
Description
Chercheur de signaux en chandeliers pour cTrader
Transformez les chandeliers japonais en un langage visuel clair.
Candlestick Signal Finder est un indicateur avancé pour cTrader qui détecte automatiquement les motifs de chandeliers japonais les plus populaires et les met en évidence directement sur votre graphique à l'aide d'étiquettes et de couleurs claires.
Plus besoin de scanner les chandeliers un par un : l'indicateur effectue la reconnaissance des motifs pour vous et montre où le prix imprime des signaux potentiels de retournement ou d'indécision.
Motifs détectés
L'indicateur identifie automatiquement :
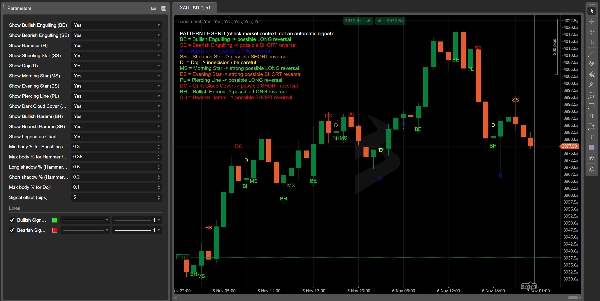
- BE – Englobante haussière → possible retournement haussier
- SE – Englobante baissière → possible retournement baissier
- H – Marteau → possible rebond/retournement haussier après une baisse
- SS – Étoile filante → possible retournement baissier après une hausse
- D – Doji → indécision, zone de prudence
- MS – Étoile du matin → fort potentiel de retournement haussier
- ES – Étoile du soir → fort potentiel de retournement baissier
- PL – Ligne de pénétration → possible retournement haussier
- DC – Nuage sombre → possible retournement baissier
- BH – Harami haussier → possible retournement haussier
- SH – Harami baissier → possible retournement baissier
Chaque motif est marqué sur la bougie exacte avec un code court (BE, H, SS, etc.) et une couleur correspondant à la légende.
Légende colorée sur le graphique
En haut à gauche du graphique, vous obtenez une légende colorée qui correspond aux signaux :
- même code
- même couleur
- brève explication de ce que cela signifie généralement (LONG / SHORT / prudence)
Cela rend l'indicateur parfait pour :
- les traders qui apprennent les motifs en chandeliers
- ceux qui veulent un rappel visuel rapide sans ouvrir un livre ou un site web
- les éducateurs ou créateurs de contenu utilisant des graphiques pour l'enseignement et les revues de trading
Paramètres entièrement personnalisables
Candlestick Signal Finder vous donne un contrôle total sur la sensibilité de détection :
- Pourcentage minimum du corps pour les chandeliers englobants et forts
- Pourcentage maximum du corps pour marteau, étoile filante et harami
- Ratio ombre longue/courte pour les motifs de type Marteau / Étoile filante
- Sensibilité du Doji (à quel point le corps doit être petit par rapport à la plage totale)
- Décalage du signal en pips pour placer les étiquettes au-dessus ou en dessous des chandeliers
- Interrupteurs individuels marche/arrêt pour chaque motif
Vous pouvez l'ajuster pour des signaux très stricts (peu nombreux mais précis) ou une détection plus permissive pour des tests visuels et de la formation.
Pourquoi les traders l'aiment
- Gagne du temps : plus besoin de chercher manuellement les motifs en chandeliers.
- Réduit la subjectivité : les règles sont numériques et reproductibles, pas basées sur l'appréciation visuelle.
- Idéal pour l'éducation : parfait pour entraîner votre œil en faisant défiler l'historique et en vérifiant la performance des motifs.
- Multi-échelle temporelle & multi-symbole : fonctionne sur indices, FX, crypto, actions, matières premières – partout où vous pouvez attacher un indicateur dans cTrader.
⚠️ Important : Candlestick Signal Finder n'est pas un système de trading complet et ne remplace pas une stratégie complète. Les motifs doivent toujours être utilisés conjointement avec l'analyse de tendance, le contexte du marché et une gestion appropriée des risques.
Résumé
The indicator offers customizable detection sensitivity, allowing users to adjust parameters like minimum and maximum body size percentages, shadow ratios, Doji sensitivity, and label positioning. Individual patterns can be enabled or disabled to tailor the indicator to specific needs.
Candlestick Signal Finder supports multiple timeframes and symbols, including indices, forex, cryptocurrencies, stocks, and commodities. It is intended to assist traders in pattern recognition, reduce subjectivity through numeric rules, and serve as an educational tool for learning candlestick analysis. The indicator does not constitute a complete trading system and should be used alongside other analysis methods and risk management practices.
Avis clients
5 | 100 % | |
4 | 0 % | |
3 | 0 % | |
2 | 0 % | |
1 | 0 % |


