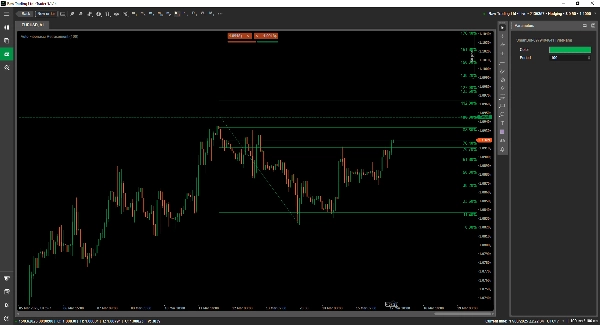
Auto Fibonacci Retracement
Logo de "Auto Fibonacci Retracement"
03/09/2025
1
Desktop
Since 29/11/2024
Volume tradé
182.07M
Pips gagnés
731.25K
Ventes
18
Free installs
453
Image mise en ligne de "Auto Fibonacci Retracement"

Introducing the Auto Fibonacci Retracement Indicator for cTrader Transform your trading experience with the cutting-edge Auto Fibonacci Retracement indicator, designed exclusively for cTrader. This tool automates the process of drawing Fibonacci retracements directly on your charts, saving you time and ensuring accuracy. By seamlessly identifying key levels, it helps traders pinpoint potential entry and exit points with precision. Whether you’re a seasoned trader or just starting, the Auto Fibonacci Retracement indicator empowers you to make more informed and confident trading decisions. Upgrade your trading strategy today!

Plus de cet auteur
Indicateur
Indices
Commodities
Forex
Smart Floating Risk - Premium version
The Floating Risk Indicator is an essential tool for traders who prioritize risk management.
Indicateur
Stocks
Forex
MACD
+1
SmartBot-Volume MACD
a revolutionary indicator that integrates volume into MACD.
SmartBot-Hand Trade Assistant_Premium
cBot : Hand Trade Assistant
SmartBot-Tenkan & ATR Indicator
The Tenkan-ATR Indicator is a powerful and innovative indicator for Traders. SALE OFF!!!
Indicateur
RSI
MACD
SmartBot-MACD & RSI Indicator
This indicator is a combination of MACD and RSI into one. This is perfect fusion and powerful indicator ever.
SmartBot-ADX47
it works with timeframe H1.
cBot
Scalping
SmartBot-RSI-M1-V1
Working with M1 timeframe. This is the best scalping bot.
Smart Floating Risk Pro
📊 Smart Floating Risk Pro – Advanced Risk Management for cTrader
SmartBot-MCDX Indicator
MCDX is a powerful and innovative indicator.
cBot
RSI
SmartBot-Advanced RSI
Work with TimeFrame M5.
Smart Daily Scalping Pro v1
Smart Daily Scalping with H1 Time Frame - XAUUSD.
cBot
Indices
RSI
SmartBot-Fibonacci
This bot is made of Fibonacci, EMA and RSI.
cBot
Indices
RSI
SmartBot-Fibonanci-FTMO
SALE OFF!!! this innovative bot combines the precision of Fibonacci Retracement, EMA and RSI...
Smart Trending Bot Pro
high-performance trading bot that redefines market precision! Built with advanced RSI, TEMA of RSI, and..
Smart Monte Carlo Bot Pro
This cbot using Monte Carlo simulation combined with secrete strategy. It works with M15.
SmartBot-ADX-v1.0
This bot works with H1 timeframe.
cBot
RSI
SmartBot-RSI Cloud
This Bot work with M5 TimeFrame.
cBot
Indices
RSI
SmartBot-RSI-M1-V2
This Bot using RSI combined with MA, it works with timeframe M1.
Vous pourriez aussi aimer
Indicateur
Indices
Prop
Stocks
+3
4MA
This indicator consists of 3 moving averages that can be configured to your liking, from the type of moving average....
Indicateur
RSI
XAUUSD
ATR
+3
RSI NextGen
The RSI NextGen is an advanced and modernized version of the classic Relative Strength Index (RSI)
Trend Bars Color
New Trend whit buy-sell signal
JMA-Like
JMA-like is a highly responsive and ultra-smooth moving average designed to replicate the behavior of the original JMA!
Indicateur
RSI
Breakout
Signal
+1
Reactive Moving Average
Combines SMA with dynamic correlation to adapt to market trends. Adjusts sensitivity, filters noise🚀📉
Indicateur
VWAP
RSI
Stocks
+2
Market Cipher B
Market Cipher B
E7 Correlation Dashboard
E7 Correlation Dashboard.
Indicateur
Stocks
Forex
MACD
MACDVolume
😎Read the description before purchasing💩
CicloQuatroVelas
Ciclo4Velas com marcação de 50% da amplitude e muito mais ! veja na descrição e bons trades.
Indicateur
RSI
Breakout
Supertrend
TrendMaster Pro MultiMA
Connects each moving average value from candle to candle, forming a fan-like structure of trendlines.
IR Spread
show spread on chart
Daily Open Pivot Level
This indicator is a valuable tool for traders looking to identify significant opening price level of any asset.
Indicateur
Breakout
Forex
support and resistance
Support and Resistance Line Indicator with Higher Timeframe Filter
True Trend H4
It draws a step line that visualize the movement of H4. Particularly effective when trade on lower timeframe.
Indicateur
RSI
XAUUSD
Breakout
+4
Dynamic Market Structure Analysis of Turning Points
Identify market structure effortlessly with swing highs, lows, CHoCH, and BOS levels for smart trading decisions! 📊🔍"
Bars color 1
This is the first version I offer you for free.
PriceLevels
Displays the previous day's, last week's, and last month's highest and lowest price levels on your chart.