
DayOfWeek - FXMaster
Indicateur
3 achats
Version 1.0, Jul 2025
Windows, Mac
4.0
Avis : 1
Description
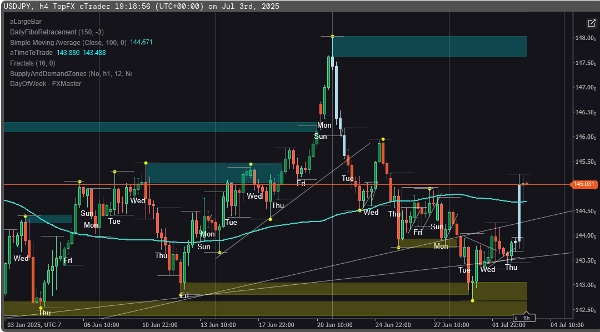
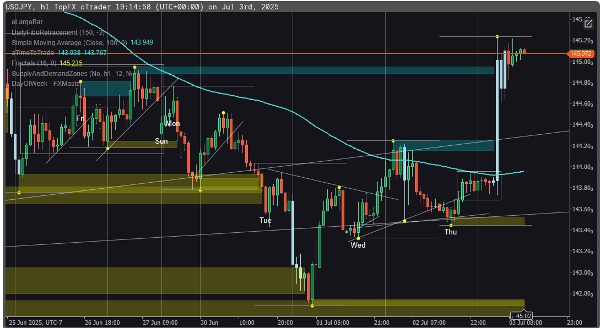
Simplifiez votre expérience de lecture des graphiques avec le Indicateur du Jour de la Semaine—un outil visuel léger qui affiche le jour de la semaine directement sur vos graphiques au début de chaque journée de trading. Conçu pour les traders qui apprécient la clarté sans encombrement, cet indicateur vous aide à identifier rapidement le rythme quotidien et le timing pour les entrées, sorties et stratégies.
✨ Fonctionnalités
- Affiche les noms des jours de la semaine : Affiche "Lun", "Mar", etc. à la première bougie de chaque nouvelle journée de trading.
- Filtrage intelligent : Étiquette uniquement la première barre de la journée pour garder votre graphique propre et lisible.
- Support de superposition : Le texte apparaît directement sur votre graphique de trading pour une utilisation intuitive.
Résumé
Résumé IA
The Day of Week Indicator for cTrader is a visual tool that displays the weekday name (e.g., "Mon", "Tue") directly on trading charts at the start of each new trading day. It is designed to enhance chart readability by labeling only the first candle of the day, thereby maintaining a clean and uncluttered view. The indicator overlays this information on the chart itself, allowing traders to quickly identify daily timing and rhythm for planning entries, exits, and strategies. It supports multiple markets including Forex, Indices, Commodities, Crypto, and Stocks. This lightweight indicator focuses on clarity and simplicity to assist traders in their daily analysis without adding visual noise.
Profil de l'indicateur
Avis clients
4.0
Avis : 1
5 | 0 % | |
4 | 100 % | |
3 | 0 % | |
2 | 0 % | |
1 | 0 % |
Discussion
Questions fréquentes
Forex
Indices
Commodities
Crypto
Stocks
Les produits disponibles sur cTrader Store, notamment les bots de trading, les indicateurs et les plug-ins, sont fournis par des développeurs tiers et mis à disposition à titre informatif et à des fins d'accès technique uniquement. cTrader Store n'est pas un courtier et ne fournit aucun conseil en investissement, aucune recommandation personnelle ni aucune garantie quant aux performances futures.


Prix
Depuis le 11/01/2025
19
Ventes