
Description
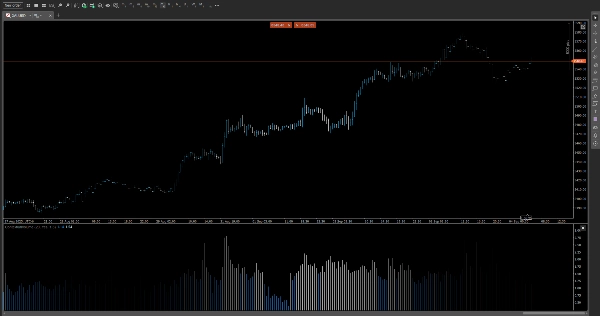
📊 Volume Relatif Intrajournalier (RVI)
Repérez les pics de volume qui comptent—au moment où ils comptent.
Le RVI est un indicateur de précision qui compare le volume actuel à sa moyenne historique pour la même heure de la journée, révélant les dynamiques cachées de momentum et de liquidité au cours des sessions intrajournalières.
🔍 Fonctionnalités clés
• Profilage du volume selon l'heure
Calcule le volume moyen par tranche horaire (par exemple, 10h15) sur les sessions précédentes, vous fournissant une référence contextuelle pour chaque chandelier.
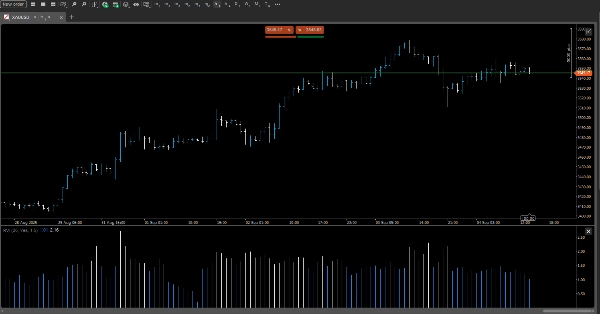
• Support Multi-Échelles de Temps
Fonctionne parfaitement des graphiques 5 minutes jusqu’aux périodes de 12 heures, s’adaptant à votre style de trading—scalping, swing ou basé sur les sessions.
• Codage Couleur Dynamique
Met en évidence les chandeliers avec un volume supérieur à la moyenne en utilisant des seuils de couleur personnalisables. Repérez instantanément les zones d’activité élevée grâce à des indices visuels intuitifs.
• Mode Ratio vs. Différence
Choisissez votre métrique préférée :
• Mode Ratio : Affiche volume actuel ÷ volume moyen (par ex., 2,3×)
• Mode Différence : Montre la déviation absolue (par ex., +1 200 contrats)
• Affichage en Superposition ou en Panneau
Basculez entre les superpositions graphiques intégrées ou un panneau latéral compact pour une intégration propre avec votre mise en page existante.
🎯 Cas d’utilisation
• Confirmez la force d’une cassure avec des pics de volume relatifs à l’activité typique
• Filtrez les faux signaux pendant les périodes de faible volume
• Identifiez les empreintes institutionnelles durant les fenêtres intrajournalières clés
• Améliorez les stratégies basées sur le volume avec un contexte temporel pertinent
⚙️ Options de personnalisation
• Période de rétroaction ajustable pour la moyenne historique
• Seuils de couleur définis par l’utilisateur pour l’intensité du volume
• Bascule du mode d’affichage (Ratio/Différence)
• Compatible avec les thèmes sombre/clair
Résumé
Avis clients
5 | 100 % | |
4 | 0 % | |
3 | 0 % | |
2 | 0 % | |
1 | 0 % |


