
HLC_Levels
Indicateur
4 achats
Version 1.0, Feb 2026
Windows, Mac
4.3
Avis : 3
Description
Description :
Arrêtez de tracer des lignes manuellement chaque jour. Advanced HLC & Session Levels est un indicateur complet conçu pour les traders professionnels qui s'appuient sur des points de référence institutionnels. Que vous tradiez le Price Action, les concepts ICT ou les stratégies de Breakout, cet outil garde votre graphique propre et vos niveaux précis.
Fonctionnalités clés :
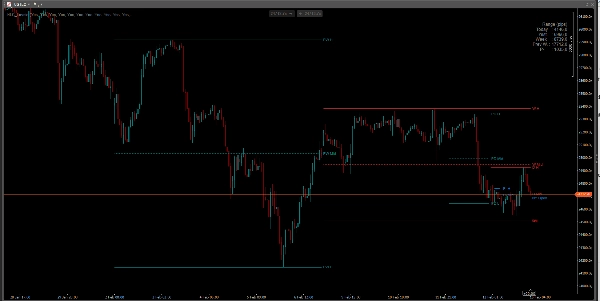
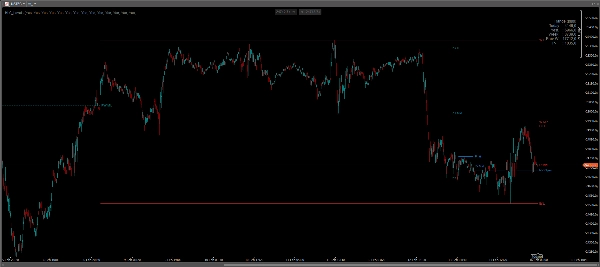
- Niveaux quotidiens : Affiche automatiquement les niveaux Haut, Bas et Milieu (50 %) d'aujourd'hui et d'hier.
- Niveaux hebdomadaires : Visualise les niveaux Haut, Bas et Milieu de la semaine en cours et de la semaine précédente.
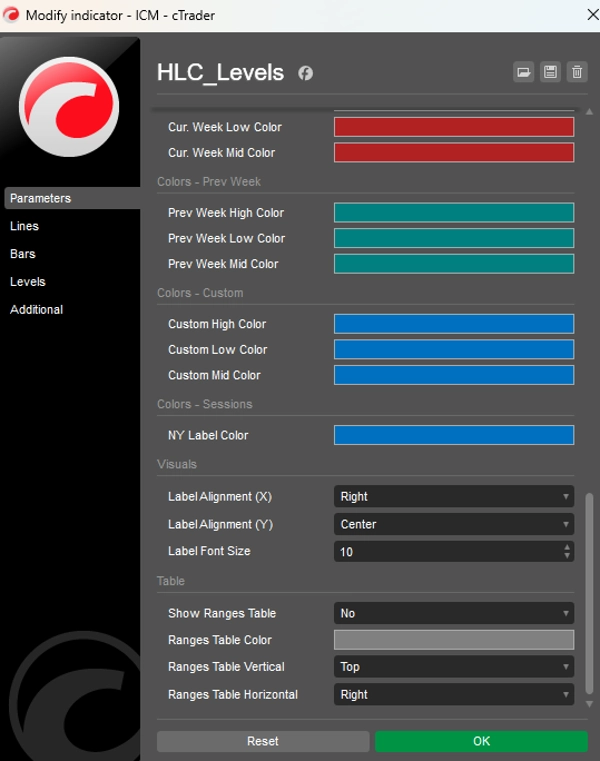
- Ouverture à minuit NY : Un bouton dédié pour le niveau de prix institutionnel de New York à 00:00 (vraie ouverture du jour), crucial pour le biais directionnel.
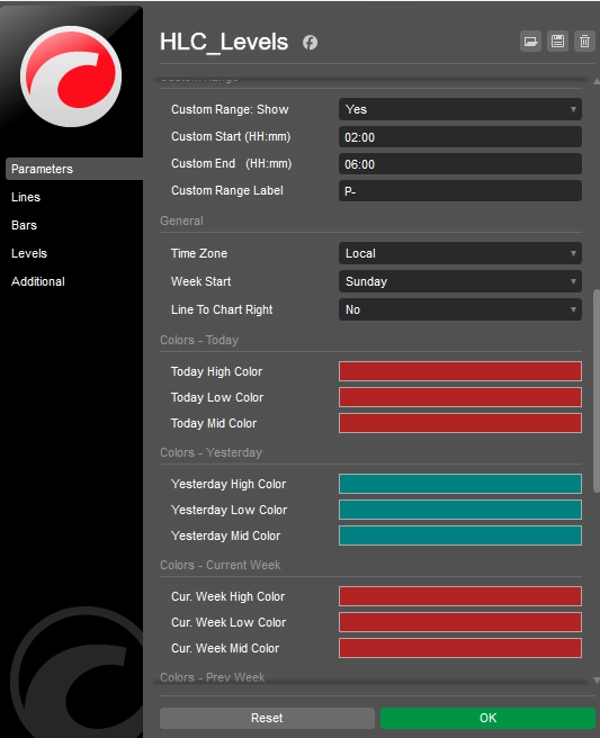
- Plage personnalisée / Session : Définissez votre propre fenêtre temporelle (par exemple, session Asie, ouverture de Londres ou équilibre initial). L'indicateur tracera le Haut, le Bas et le Milieu pour cette période spécifique.
- Tableau de bord de volatilité : Un tableau sur le graphique affichant la plage en pips (Haut moins Bas) pour le jour, hier, la semaine, la semaine précédente et votre plage personnalisée.
- Intelligence du fuseau horaire : Fonctionne avec l'heure du courtier, UTC, NY ou locale pour garantir que les niveaux correspondent à votre stratégie.
Pourquoi utiliser cet indicateur ?
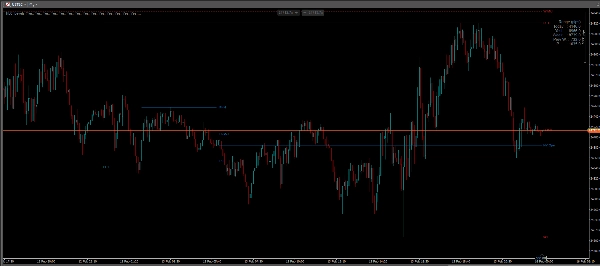
- Points de réaction : Les anciens hauts/bas et points médians agissent souvent comme de forts supports et résistances.
- Milieu (Équilibre) : Le niveau à 50 % est clé pour identifier les prix "Discount" vs "Premium".
- Entièrement personnalisable : Activez ou désactivez n'importe quelle ligne. Changez les couleurs, styles de ligne et positions des étiquettes pour correspondre à votre modèle.
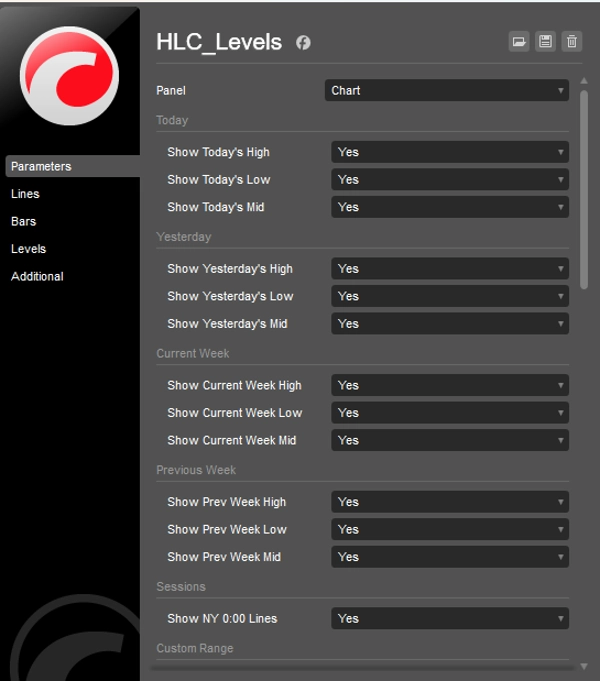
Paramètres :
- Activez/désactivez des périodes spécifiques (Aujourd'hui, Hier, Semaine, Semaine précédente).
- Heures de début/fin personnalisées pour des plages de session spécifiques.
- Option "Étendre les lignes" pour projeter les niveaux dans le futur.
- Couleurs personnalisées pour chaque groupe de lignes.
Résumé
Profil de l'indicateur
Avis clients
4.3
Avis : 3
5 | 33 % | |
4 | 67 % | |
3 | 0 % | |
2 | 0 % | |
1 | 0 % |
Avis clients
May 16, 2026
Bit weird to see there is no Close level eventhough it's called HLC_levels.. There is a high and low and a mid, but no close. I kinda find it essential to have a close though. Other than that is safes me huge amount of time daily to not set all these levels manually. So besides the lack of the close level i still like this indicator. Would love to see a new version with the added close level as the name suggests
March 2, 2026
A 5 minute check should not become a 30 minute rabbit hole, and the entry needs one more reason to make sense.
February 21, 2026
most of the value comes from the decision gets a little more breathing room. The market context still matters.
Discussion
Questions fréquentes
Prop
Forex
Scalping
Indices
SMC
AI
XAUUSD
NAS100
USDJPY
Les produits disponibles sur cTrader Store, notamment les bots de trading, les indicateurs et les plug-ins, sont fournis par des développeurs tiers et mis à disposition à titre informatif et à des fins d'accès technique uniquement. cTrader Store n'est pas un courtier et ne fournit aucun conseil en investissement, aucune recommandation personnelle ni aucune garantie quant aux performances futures.


Prix
24
Ventes
662
Installations gratuites