
説明
Zero Lag LSMA(最小二乗移動平均)は、トレンド分析において応答性と精度の向上を求めるトレーダー向けに設計された最先端のテクニカル指標です。従来の価格変動に遅れる移動平均とは異なり、二重線形回帰プロセスを適用して遅延を最小限に抑え、リアルタイムでのトレンド方向や潜在的な反転の特定に最適です。この指標は、外国為替、株式、商品、その他の市場に適しています。
主な特徴
- ゼロラグ性能: 従来の移動平均に内在する遅延を減らし、トレンド変化のシグナルをより速く提供します。
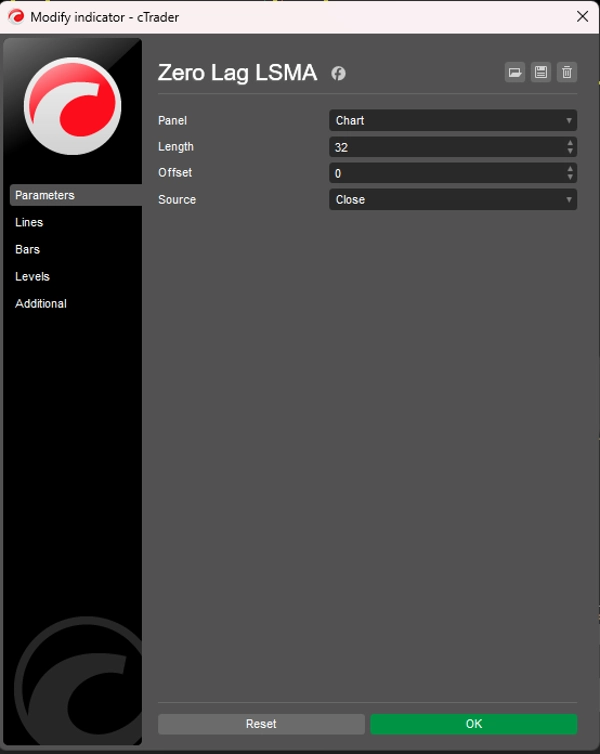
- カスタマイズ可能なパラメータ: 長さ、オフセット、価格ソース(始値、高値、安値、終値)を調整して、取引戦略に合わせることができます。
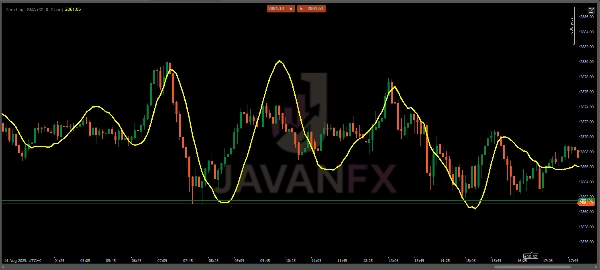
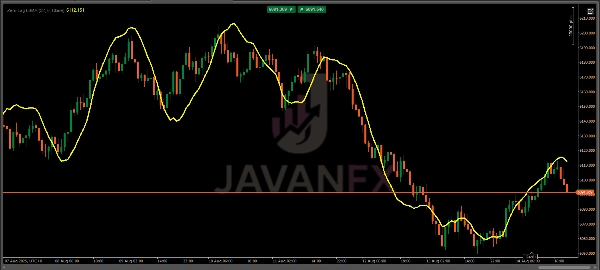
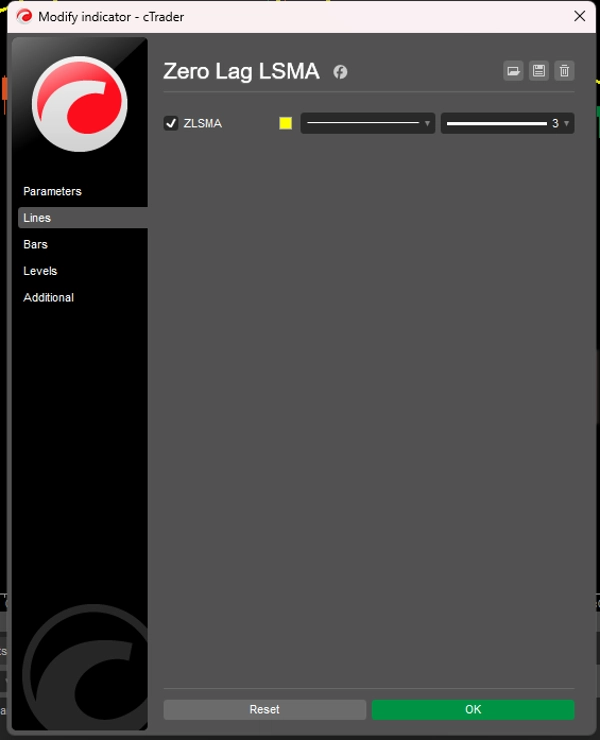
- 視覚的に直感的: 価格チャート上に滑らかな黄色の線として表示され、解釈が容易です。
- 多用途な応用: スキャルピング、デイトレード、スイングトレード、長期戦略など、さまざまな時間軸で適用可能です。
使い方
- トレンドの識別:
-
- ZLSMAラインが上向きに傾いている場合、強気トレンドを示します。
- 下向きの傾きは弱気トレンドを示唆します。
- 平坦または乱高下する動きは、統合またはトレンドの欠如を示す場合があります。
- エントリー/エグジットシグナル:
-
- 買いシグナル: 価格がZLSMAラインを上抜けたとき、特に確認された上昇トレンドの後にロングポジションを取ります。
- 売りシグナル: 価格がZLSMAラインを下抜けたとき、下降トレンド中にショートポジションを取ります。
- エグジットシグナル: 価格が再びZLSMAを横切るか、ラインが平坦になるときに、トレンド反転の可能性を示し、ポジションの決済を検討します。
- 確認:
-
- ZLSMAを他の指標(例:RSI、MACD)やサポート/レジスタンスレベルと組み合わせてシグナルを確認し、誤ったブレイクアウトを避けます。
- より強力なトレンドシグナルには高い時間軸(H1、H4、D1)で、スキャルピングには低い時間軸(M5、M15)で使用します。
取引戦略
- トレンドフォロー: ZLSMAを使って強いトレンドに乗り、トレンド方向へのプルバックでエントリーします。
- 反転取引: ZLSMAラインからの価格のダイバージェンスとローソク足パターン(例:ピンバー、包み足)を組み合わせて反転のセットアップを探します。
- ブレイクアウト取引: 高ボラティリティ期間中にZLSMAの上下での価格ブレイクアウトを監視し、潜在的なエントリーポイントを探します。
最適な使用のためのヒント
- 市場状況に応じて長さを調整: 速い市場やスキャルピングには短い長さ(例:10-20)を使用し、高い時間軸での滑らかなトレンドには長い長さ(例:50-100)を使用します。
- デモアカウントでテスト: 実際の取引で使用する前に、デモアカウントでZLSMAをバックテストし、好みの市場での挙動を理解します。
- 乱高下する市場での過剰取引を避ける: ZLSMAはトレンド市場で最も効果的です。横ばい市場での誤動作を避けるために追加のフィルター(例:ADX)を使用してください。
概要
AIによる概要
The Zero Lag LSMA (Least Squares Moving Average) is a technical indicator designed to enhance trend analysis by minimizing the lag typical of traditional moving averages. It uses a double linear regression process to provide faster and more responsive signals, making it suitable for real-time identification of trend direction and potential reversals. The indicator is applicable across various markets including forex, stocks, and commodities.
Key features include customizable parameters such as length, offset, and price source (Open, High, Low, Close), allowing adaptation to different trading strategies. It displays as a smooth yellow line overlaid on the price chart for clear visual interpretation. The indicator supports multiple trading styles and timeframes, from scalping to long-term strategies.
Traders use the Zero Lag LSMA to identify trends by observing the slope of the line: upward for bullish trends, downward for bearish, and flat for consolidation. Entry and exit signals are generated when price crosses the LSMA line, with additional confirmation recommended through other indicators or support/resistance levels. The indicator supports trend following, reversal, and breakout trading strategies, with adjustable settings to optimize performance under varying market conditions.
インジケーターのプロフィール
カスタマーレビュー
4.6
レビュー: 3
5 | 67 % | |
4 | 33 % | |
3 | 0 % | |
2 | 0 % | |
1 | 0 % |
カスタマーレビュー
October 10, 2025
Zero lag, full clarity ⚡ LSMA tracks price action like a scalpel — sharp, fast, and smooth. Great trend filter for any timeframe!
August 27, 2025
The only reason it stays interesting is the setup needs less second guessing. A normal demo run is enough to see the weak spots.
August 16, 2025
Not bad if the rules are already clear. Spread and slippage need a line in the notes.
ディスカッション
よくあるご質問
cTrader Storeで入手可能な取引ボット、インジケーター、プラグインなどの商品は、第三者の開発者が提供するものであり、情報と技術の取得のみを目的としてご利用いただけます。cTrader Storeはブローカーではなく、投資助言や個人的な推奨を行うことも、将来のパフォーマンスを保証することもありません。


![「[CB] Pivot Points Pro」ロゴ](https://cdn.ctrader.com/image/webp/43463c82-67b0-4f10-a4ba-901bba091d81_32594)


価格
登録日 14/07/2025
60
販売