
説明
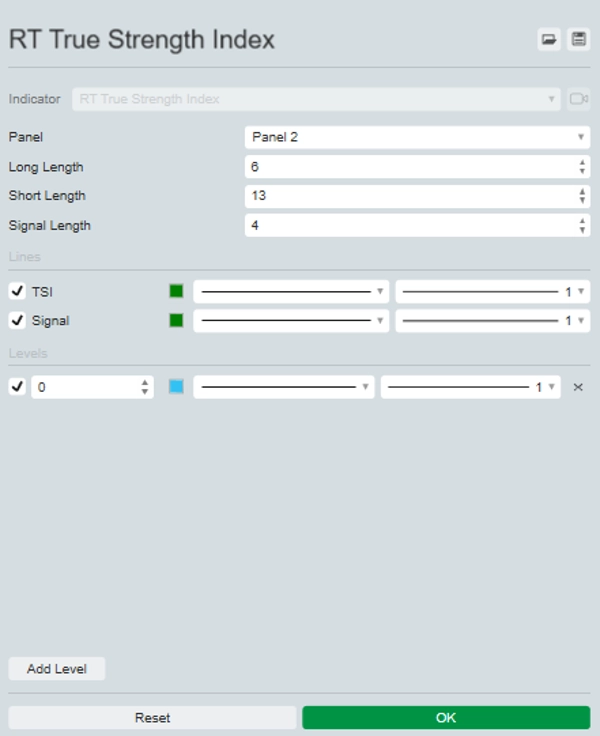
True Strength Index(TSI)インジケーターのご紹介。これは、市場の勢いとトレンドの強さに関する明確な洞察を提供することで、あなたの取引戦略を強化するために設計された強力なツールです。
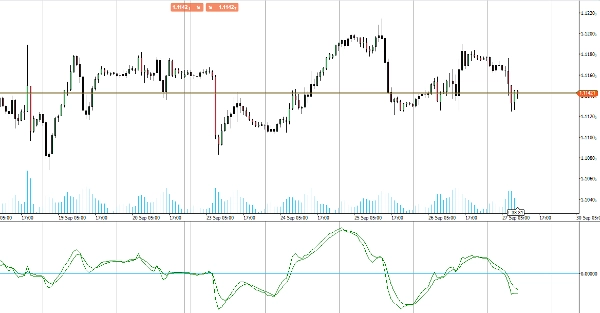
TSIインジケーターは、価格変動の基礎となる強さを測定し、市場のノイズを平滑化してトレンドの方向性をより正確に把握できるようにします。買われ過ぎや売られ過ぎの状態を強調することで、TSIは潜在的な反転ポイントの特定やトレンド継続の確認に役立ちます。
TSIは、金融商品の基礎となるモメンタムの移動平均を使用します。モメンタムは価格変動の先行指標と考えられており、移動平均は通常価格に遅れて追従します。TSIはこれらの特性を組み合わせ、市場の転換点とより同期した価格と方向の指標を作り出します。モメンタムや移動平均のいずれか単独よりも優れています。
分析を洗練し意思決定を改善したいトレーダーに最適なTSIインジケーターは、市場の動態を評価する信頼性が高く直感的な方法を提供します。True Strength Indexで取引ツールキットをアップグレードし、優れた取引パフォーマンスを実現しましょう。
概要
インジケーターのプロフィール
カスタマーレビュー
0.0
レビュー: 0
カスタマーレビュー
この商品にはまだレビューがありません。お使いになったことがある方は、ぜひレビューをお願いします。
ディスカッション
よくあるご質問
BTCUSD
Forex
Indices
EURUSD
Commodities
GBPUSD
NZDUSD
Crypto
Stocks
XAUUSD
NAS100
USDJPY
cTrader Storeで入手可能な取引ボット、インジケーター、プラグインなどの商品は、第三者の開発者が提供するものであり、情報と技術の取得のみを目的としてご利用いただけます。cTrader Storeはブローカーではなく、投資助言や個人的な推奨を行うことも、将来のパフォーマンスを保証することもありません。


価格
登録日 25/09/2024
20
販売