
説明
ピボットポイントインジケーター
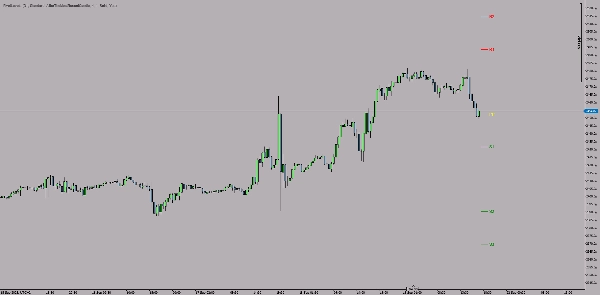
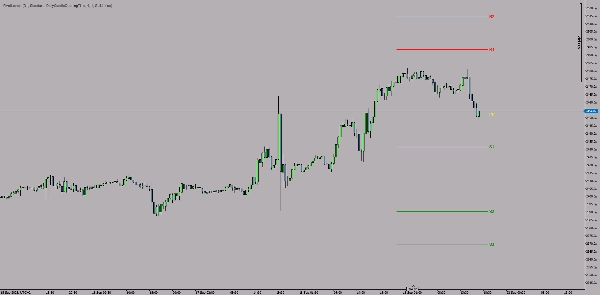
Pivot Pointsは、cTraderプラットフォーム向けのテクニカルインジケーターで、チャート上にトレンドラインとしてピボットポイントを自動計算・表示します。
主な特徴:
🎯 ピボットタイプ:
- 標準ピボットポイント
- フィボナッチピボットポイント
- ウッディピボットポイント
- カマリラピボットポイント
📊 レベル:
- 中央ピボットポイント (PP) - 黄色
- レジスタンスレベル (R1, R2, R3) - 赤色
- サポートレベル (S1, S2, S3) - 緑色
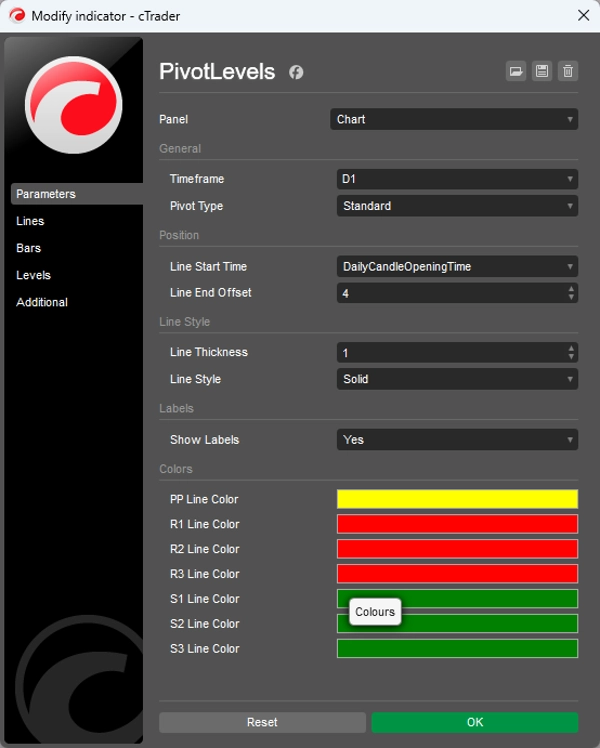
⚙️ カスタマイズ可能な設定:
- タイムフレーム: 日次、週次、またはその他のタイムフレーム選択
- ラインスタイル: 太さ(1-5)および種類(実線、破線など)
- 位置設定: ラインの開始時間と長さ
- 色: 各レベルの色を個別に調整可能
- ラベル: テキストラベルのオン/オフ切り替え
💡 使用方法:
このインジケーターは、前期間(日/週)の高値、安値、終値(および始値)を基にピボットレベルを計算し、次の取引期間の主要なサポートおよびレジスタンスエリアを特定します。
テクニカルレベルに基づく戦略を用いるスイングトレーダーやデイトレーダーに最適です。
概要
AIによる概要
PivotLevels is a technical indicator for the cTrader platform that automatically calculates and displays pivot points as trendlines on trading charts. It supports multiple pivot point calculation methods, including Standard, Fibonacci, Woodie, and Camarilla pivots. The indicator plots key levels such as the Central Pivot Point (PP) in yellow, resistance levels (R1, R2, R3) in red, and support levels (S1, S2, S3) in green.
Users can customize various settings, including the timeframe for pivot calculation (daily, weekly, or others), line style (thickness and type), line positioning (start time and length), colors for each level, and the option to toggle text labels on or off. The pivot levels are derived from the previous period’s high, low, close, and open prices, helping identify potential support and resistance zones for the upcoming trading period.
This indicator is suitable for traders who use technical levels in their strategies, particularly swing and day traders. It supports multiple markets such as forex, indices, commodities, cryptocurrencies, and stocks.
インジケーターのプロフィール
カスタマーレビュー
4.5
レビュー: 2
5 | 50 % | |
4 | 50 % | |
3 | 0 % | |
2 | 0 % | |
1 | 0 % |
カスタマーレビュー
September 30, 2025
The review gets easier when the decision feels less rushed, and The setup needs patience.
ディスカッション
よくあるご質問
Prop
Forex
Indices
Commodities
Crypto
Stocks
cTrader Storeで入手可能な取引ボット、インジケーター、プラグインなどの商品は、第三者の開発者が提供するものであり、情報と技術の取得のみを目的としてご利用いただけます。cTrader Storeはブローカーではなく、投資助言や個人的な推奨を行うことも、将来のパフォーマンスを保証することもありません。


価格
登録日 05/01/2025
14
販売