
説明
主な特徴:
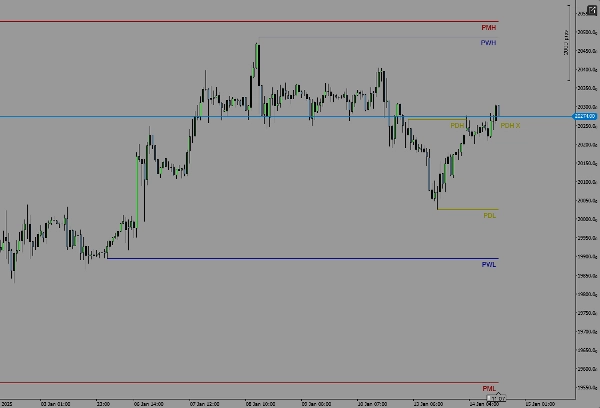
- 昨日の高値と安値を表示します。
- 先週の高値と安値を表示します。
- 先月の高値と安値を表示します。
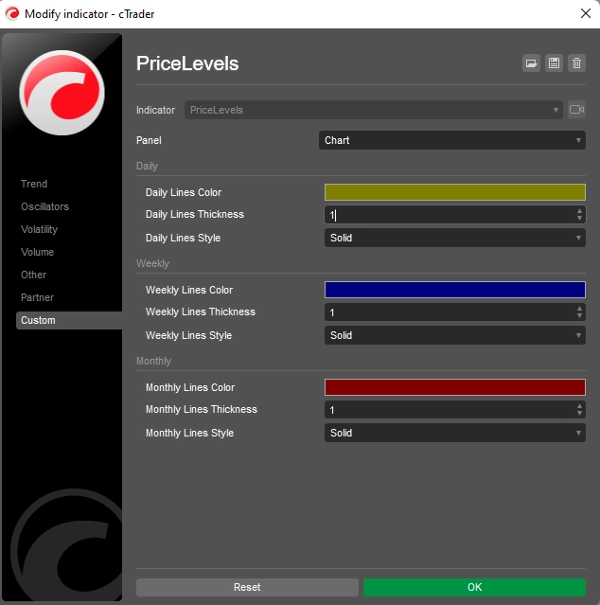
- 各レベルの色と線のスタイルをカスタマイズ可能です。
仕組み:
このインジケーターは、チャートの時間枠に基づいて前日の、週の、月の最高値と最安値を自動的に計算します。これらのレベルはチャート上に水平線としてプロットされ、過去の価格動向を明確に視覚的に参照できます。
対応環境:
- cTraderプラットフォーム専用に設計されています。
- すべての時間枠と銘柄で動作します。
ご質問、ご意見、改善のご提案がありましたら、お気軽にお問い合わせください!皆様のご意見は非常に重要であり、このインジケーターをさらに良くするための助けとなります。
良いトレードを!
概要
AIによる概要
PriceLevels is an indicator designed for the cTrader platform that automatically calculates and displays key historical price levels on trading charts. It plots the highest and lowest prices from the previous day, last week, and last month as horizontal lines, providing traders with clear visual references for past price action. The indicator supports all timeframes and instruments available on cTrader. Users can customize the colors and line styles for each displayed level to suit their charting preferences. This tool aids in identifying significant support and resistance zones based on recent historical data.
インジケーターのプロフィール
カスタマーレビュー
5.0
レビュー: 2
5 | 100 % | |
4 | 0 % | |
3 | 0 % | |
2 | 0 % | |
1 | 0 % |
ディスカッション
よくあるご質問
cTrader Storeで入手可能な取引ボット、インジケーター、プラグインなどの商品は、第三者の開発者が提供するものであり、情報と技術の取得のみを目的としてご利用いただけます。cTrader Storeはブローカーではなく、投資助言や個人的な推奨を行うことも、将来のパフォーマンスを保証することもありません。


![「[Stellar Strategies] MARSI Signal Plotter」ロゴ](https://cdn.ctrader.com/image/webp/7b2b8da6-8f8e-4646-8d4a-4710c516c01e_25567)


価格
登録日 05/01/2025
14
販売