
説明
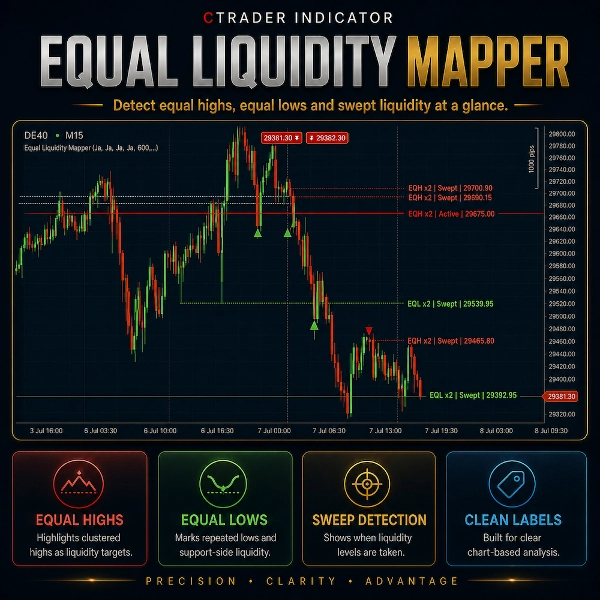
Equal Liquidity Mapperは、チャート上で等しい高値、等しい安値、および潜在的な流動性プールを直接識別するために設計された視覚的なcTraderインジケーターです。
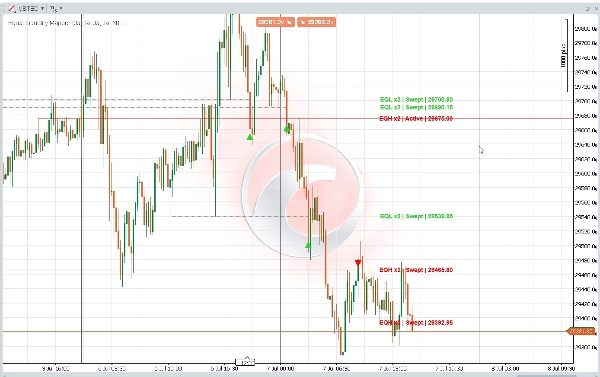
このインジケーターはスイング高値とスイング安値をスキャンし、設定可能な許容範囲内の近接レベルをグループ化し、アクティブな流動性エリアをクリーンな水平ゾーンとレベルラインとして表示します。また、流動性プールがすでにスイープされたかどうかを検出し、オプションでスイープされたレベルとスイープ矢印を表示することもできます。
Equal Liquidity Mapperは、プライスアクション分析、流動性ベースのチャートレビュー、市場構造の研究、およびバックテスト準備に役立ちます。
主な特徴:
- 等しい高値の検出
- 等しい安値の検出
- アクティブな流動性プールの可視化
- オプションのスイーププール表示
- スイープ矢印マーカー
- 調整可能なスイング強度
- 調整可能な遡及範囲
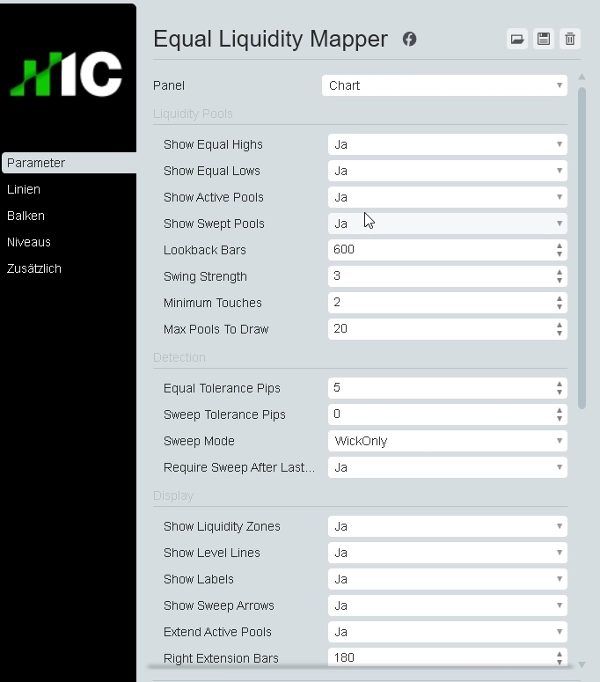
- 設定可能な等レベル許容範囲
- 設定可能なスイープ検出
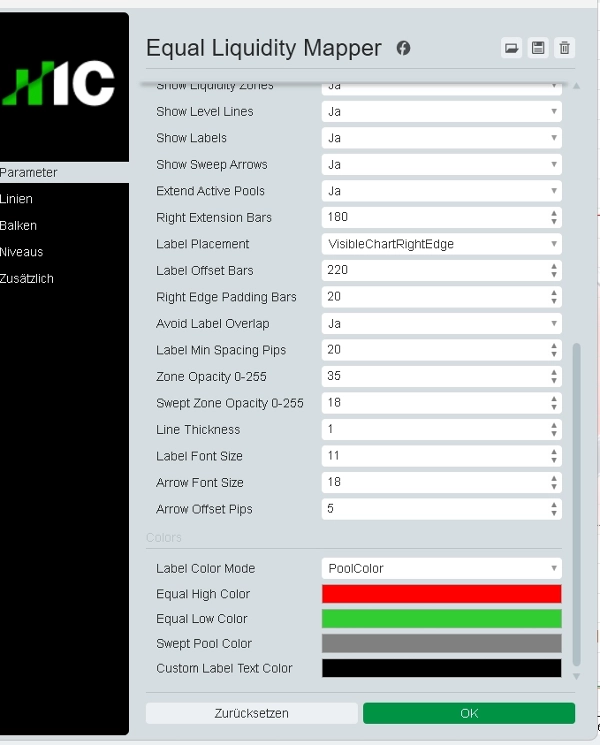
- 右端ラベル配置
- ラベル重なり防止
- カスタムカラー、不透明度およびライン設定
- クリーンなチャートオーバーレイ
- 制限付きアクセス権を持つストア安全なインジケーター
Equal Liquidity Mapperはトレーディングロボットではありません。取引を実行したり、注文を変更したり、保証された売買シグナルを提供したりすることはありません。これは視覚的な分析および市場コンテキストツールのみです。
取引にはリスクが伴います。このインジケーターは金融アドバイス、投資推奨、統計的確率、または保証された取引結果を提供しません。
概要
AI summary
Equal Liquidity Mapper is a visual indicator for the cTrader platform that identifies and maps equal highs, equal lows, and active liquidity pools directly on price charts. It analyzes swing highs and lows, groups nearby levels within a user-configurable tolerance, and displays these as horizontal zones and lines to highlight potential liquidity areas. The indicator can detect whether liquidity pools have been swept and optionally marks these with arrows and labels.
Key features include adjustable swing strength and lookback range, configurable equal-level tolerance and sweep detection, label overlap protection, and customizable colors and opacity. The indicator provides a clean chart overlay designed for price action analysis, liquidity-based chart review, market structure research, and backtesting preparation.
Equal Liquidity Mapper does not execute trades or provide trading signals; it serves solely as a market context and visual analysis tool. It supports visualization of key market structure concepts such as liquidity grabs, market structure shifts, and key levels. The indicator operates on bar data and supports signals like divergence, reversal, level breaks, and session open range.
Key features include adjustable swing strength and lookback range, configurable equal-level tolerance and sweep detection, label overlap protection, and customizable colors and opacity. The indicator provides a clean chart overlay designed for price action analysis, liquidity-based chart review, market structure research, and backtesting preparation.
Equal Liquidity Mapper does not execute trades or provide trading signals; it serves solely as a market context and visual analysis tool. It supports visualization of key market structure concepts such as liquidity grabs, market structure shifts, and key levels. The indicator operates on bar data and supports signals like divergence, reversal, level breaks, and session open range.
インジケーターのプロフィール
インジケーターのカテゴリー
市場構造(SMC)
出力の種類
ビジュアル表示
データ要件
バーのみ
サポート対象のシグナル
ダイバージェンス
反転
ラインブレイク
セッション開始レンジ
カスタマーレビュー
0.0
レビュー: 0
カスタマーレビュー
この商品にはまだレビューがありません。お使いになったことがある方は、ぜひレビューをお願いします。
ディスカッション
よくあるご質問
Key Levels
MSS
Market Structure
Liquidity Grab
cTrader Storeで入手可能な取引ボット、インジケーター、プラグインなどの商品は、第三者の開発者が提供するものであり、情報と技術の取得のみを目的としてご利用いただけます。cTrader Storeはブローカーではなく、投資助言や個人的な推奨を行うことも、将来のパフォーマンスを保証することもありません。