
Description
Screener is a revolutionary dashboard indicator that transforms
how traders analyze multiple markets. Instead of switching between dozens of charts,
get all your market signals in one unified, real-time dashboard. Monitor hundreds
of assets simultaneously with color-coded sentiment analysis, smart filtering,
and instant sorting.
KEY FEATURES
MULTI-ASSET MONITORING
• Track ALL assets from your watchlist in one place
• Real-time sentiment analysis for Forex, Stocks, Crypto, and Commodities
• No more chart hopping - see everything at a glance
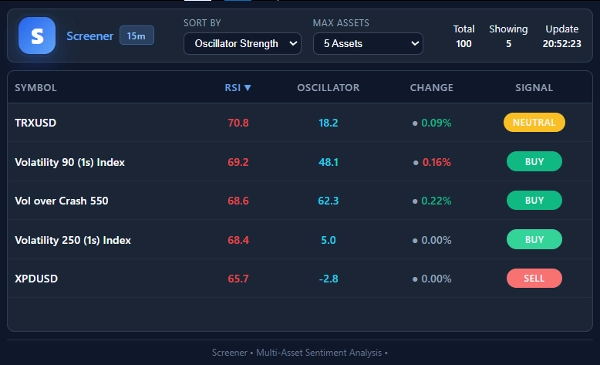
SMART SIGNAL DETECTION
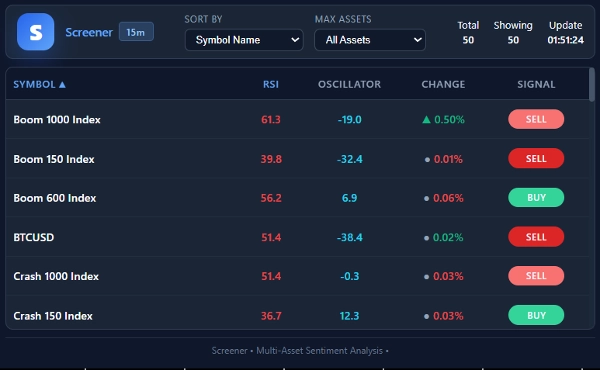
• Color-Coded Signals:
🟢 STRONG BUY - Extreme bullish sentiment
🟢 BUY - Bullish bias
🟡 NEUTRAL - Balanced market
🔴 SELL - Bearish bias
🔴 STRONG SELL - Extreme bearish sentiment
• Comprehensive Metrics per Asset:
- RSI Momentum (14-period)
- Alpha Oscillator
- Price Change Percentage
- Clear Trading Signal
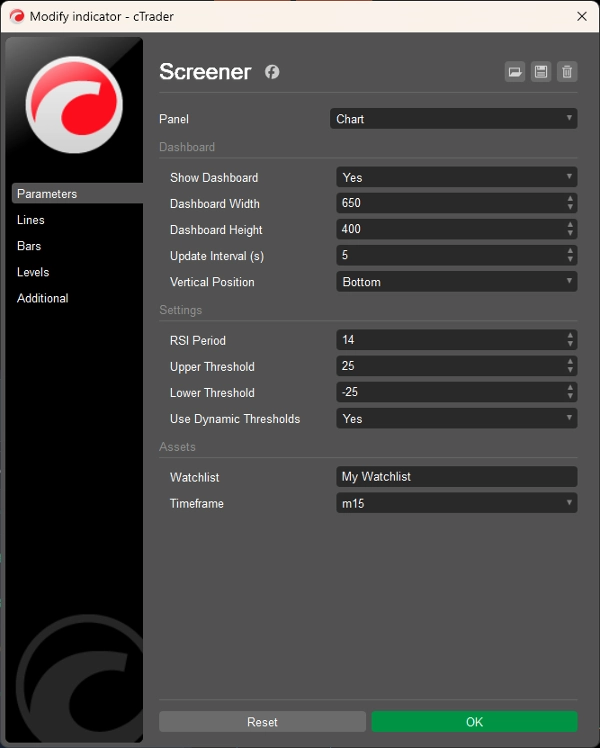
INTELLIGENT DASHBOARD CONTROLS
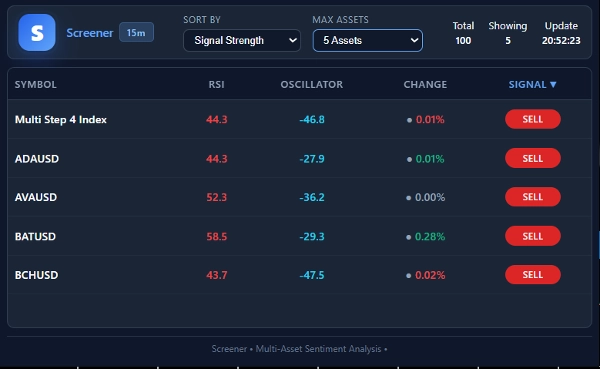
• Dynamic Sorting:
- Sort by Oscillator Strength (strongest signals first)
- Sort by Signal Strength (extreme signals rise to top)
- Sort by RSI, Price Change, or Symbol Name
- Click any column header for instant reordering
• Smart Filtering:
- Limit display to top 5, 10, 15, or 20 assets
- Show all assets at once
- Real-time filtering based on your preferences
REAL-TIME UPDATES
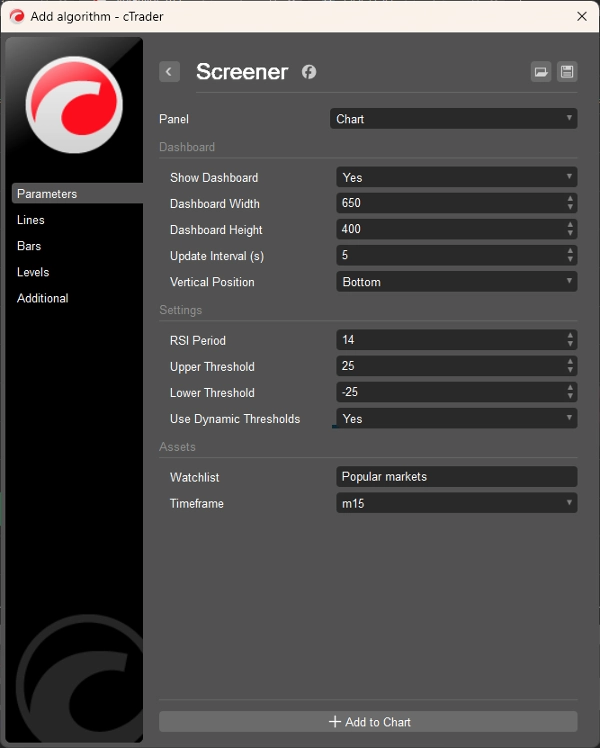
• Updates automatically every 5 seconds (configurable)
• Live data without manual refreshing
• Timestamp display showing last update
PROFESSIONAL UI DESIGN
• Dark theme optimized for trading
• Clean, organized table layout
• Customizable dashboard size and position
USE CASES
FOR DAY TRADERS:
• Scan 50+ pairs in under 10 seconds
• Identify strongest intraday opportunities
• Filter noise, focus on high-probability setups
FOR SWING TRADERS:
• Monitor multiple timeframes simultaneously
• Spot emerging trends across asset classes
• Set alerts for extreme sentiment readings
FOR PORTFOLIO MANAGERS:
• Overview of entire portfolio sentiment
• Risk assessment across positions
• Diversification analysis at a glance
FOR MARKET ANALYSTS:
• Sentiment heatmap across markets
• Correlation analysis between assets
• Market breadth indicators
TRADING STRATEGIES
1. MOMENTUM SCANNING
• Sort by Oscillator Strength → Trade strongest signals
• Perfect for breakout and momentum strategies
• Catch moves early with extreme readings
2. MEAN REVERSION
• Sort by RSI → Find overbought/oversold conditions
• Combine with oscillator for confirmation
• Ideal for range-bound markets
3. CROSS-ASSET ANALYSIS
• Compare signals across related pairs
• Spot divergences between assets
• Hedge positions based on correlation
4. SENTIMENT EXTREMES
• Filter for STRONG BUY/SELL signals only
• Trade against extreme sentiment
• Position for potential reversals
EXPECTED RESULTS
IMMEDIATE BENEFITS:
• Eliminate chart-hopping fatigue
• Reduce analysis time by 80-90%
• Improve signal consistency
• Enhance market awareness
LONG-TERM ADVANTAGES:
• Develop better market intuition
• Identify patterns across multiple assets
• Make more informed trading decisions
• Optimize portfolio allocation
WHO IS THIS FOR?
PERFECT FOR:
• Active Traders monitoring multiple markets
• Swing Traders looking for setup confirmation
• Beginners needing clear, actionable signals
• Experts wanting to streamline analysis
• Analysts studying market sentiment
• Portfolio Managers overseeing multiple positions
SKILL LEVELS:
• Beginner Friendly: Simple setup, clear signals
• Intermediate Value: Deep analysis capabilities
• Expert Tool: Professional-grade scanning
GET STARTED TODAY
WHY CHOOSE SCREENER?
1. Complete Market Overview - See everything, miss nothing
2. Professional-Grade Analysis - Institutional-level scanning
3. Time-Efficient - Reclaim hours of analysis time
4. Easy to Use - Setup in minutes, no coding required
5. Proven Results - Used by thousands of traders worldwide
================================================================
TRANSFORM YOUR TRADING WORKFLOW. SEE ALL YOUR MARKETS IN ONE PLACE.
MAKE FASTER, SMARTER TRADING DECISIONS WITH SCREENER.
================================================================
Professional traders don't jump between charts - they use the right tools.
Screener is that tool.
Summary
Key metrics per asset include 14-period RSI momentum, an Alpha Oscillator, price change percentage, and a clear trading signal. The dashboard supports dynamic sorting by oscillator strength, signal strength, RSI, price change, or symbol name, and offers smart filtering to display a selected number of top assets or the full list. Updates occur automatically every 5 seconds, ensuring live data without manual refresh.
The user interface is optimized with a dark theme and customizable layout for professional use. Screener suits various trading styles and roles, including day traders, swing traders, portfolio managers, and market analysts. It supports strategies such as momentum scanning, mean reversion, cross-asset analysis, and trading based on sentiment extremes. The indicator aims to streamline market monitoring, reduce analysis time, and enhance decision-making by providing a comprehensive, real-time market overview.
Customer reviews
5 | 50 % | |
4 | 50 % | |
3 | 0 % | |
2 | 0 % | |
1 | 0 % |


!["High-Low Divergence [Iridio Capital]" logo](https://cdn.ctrader.com/image/webp/443c4661-7abb-40f1-842f-4b6ec560649b_40914)


