Description
IM_AngleIndicator turns the slope of a simple moving average into an objective, comparable angular measure.
Most "angle" indicators calculate slope from the raw price change, but the result depends on the instrument's absolute scale and on the timeframe — so the same degree value means completely different things on a currency cross, an index, or a cryptocurrency. IM_AngleIndicator solves this by normalizing the SMA change by the ATR: the slope is expressed in "ATR per bar" and then converted into degrees. This way, a slope of 45° always represents a movement of 1 ATR per bar, regardless of the instrument or timeframe being analyzed. The result is a consistent reading and thresholds that can be reused across the entire portfolio.
How it works
- Calculates the SMA on closing prices according to the chosen period.
- Measures its change between two consecutive bars and normalizes it by dividing by the ATR.
- Converts the resulting ratio into degrees via arctangent, returning a value roughly between −90° and +90°.
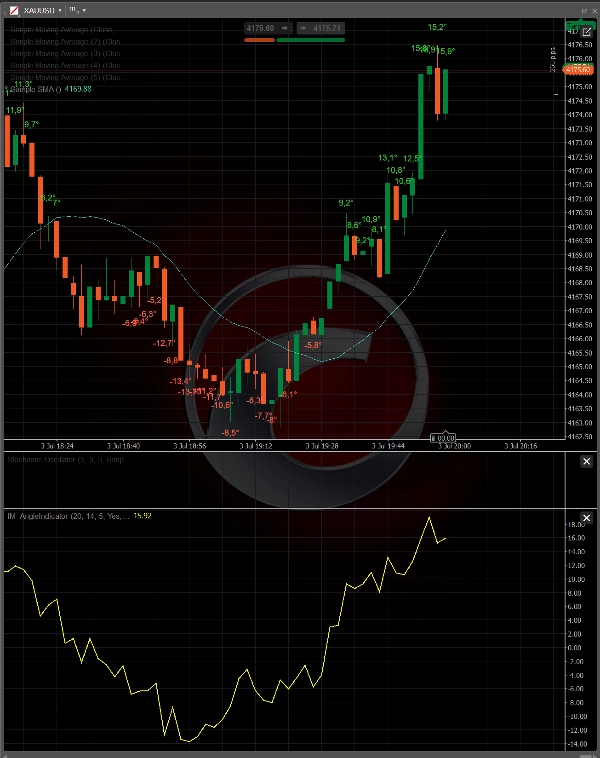
- Plots the value as an oscillator in a dedicated panel and, when the slope exceeds the set threshold, adds a label on the price chart positioned above the high (bullish trend) or below the low (bearish trend).
Key features
- Slope measurement independent of instrument and timeframe thanks to ATR normalization.
- Configurable threshold in degrees to filter significant moves and exclude noise.
- Directional color-coded labels (green for rising, red for falling) with an ATR-based vertical offset for clean placement relative to the candles.
- Optimized chart-object handling: labels are limited to the most recent bars to preserve performance even on charts with long histories.
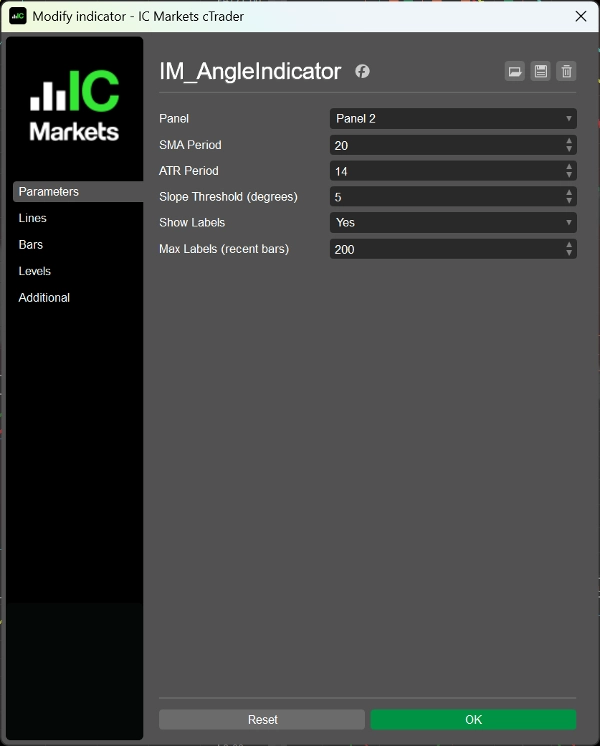
- Fully customizable parameters: SMA period, ATR period, slope threshold, label visibility, and maximum number of labels.
Use cases
- Identifying strong-trend phases versus sideways ranges.
- Directional confirmation to support entry and exit strategies.
- Comparing trend strength across multiple instruments using the same threshold.
- A foundation for developing cBots that use the normalized slope as a trading signal.
Summary
Key features include:
- ATR normalization for consistent slope measurement regardless of instrument or timeframe.
- Configurable angle thresholds to filter significant trend moves and reduce noise.
- Directional labels positioned relative to price bars for clear trend visualization.
- Customizable parameters such as SMA period, ATR period, slope threshold, label visibility, and maximum label count.
- Optimized label management for performance on long chart histories.
Use cases involve identifying strong trend phases, detecting potential reversals, confirming trade entries and exits, and comparing trend strength across multiple markets including Forex, commodities, and indices.
Customer reviews
5 | 67 % | |
4 | 33 % | |
3 | 0 % | |
2 | 0 % | |
1 | 0 % |