Description
Trend SR System is a trend-oriented chart indicator designed to help traders identify market context, key EMA structure, dynamic support/resistance levels, and potential continuation or short-term mean-reversion zones more clearly.
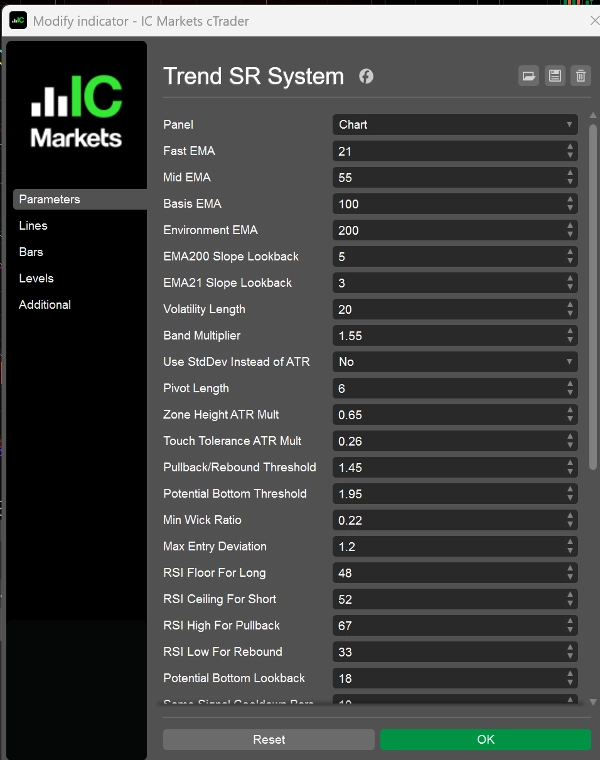
The indicator is built around EMA21, EMA55, EMA100, and EMA200:
- EMA200 is used as the higher-level market environment filter
- EMA100 acts as the central price axis and band baseline
- EMA55 helps identify medium-term support and resistance pressure
- EMA21 is used to track short-term rhythm, pullbacks, and retracements
On top of that, the indicator combines volatility bands, pivot-based structural zones, and step-style dynamic support/resistance logic to provide a more structured view of the market.
Main Features
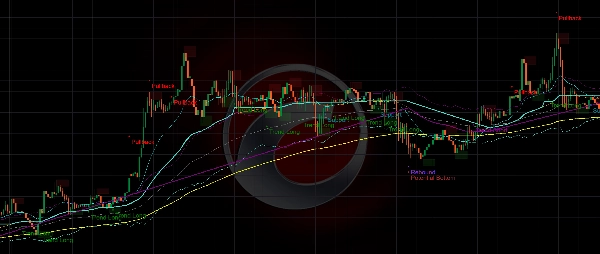
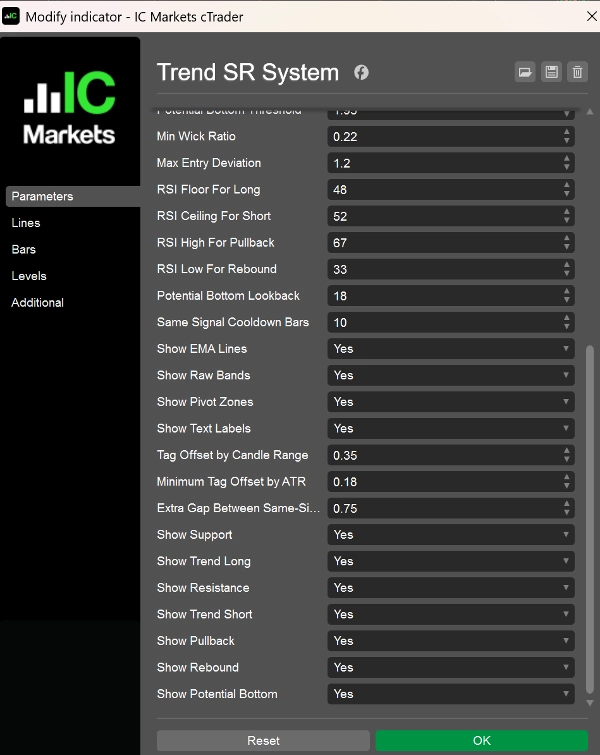
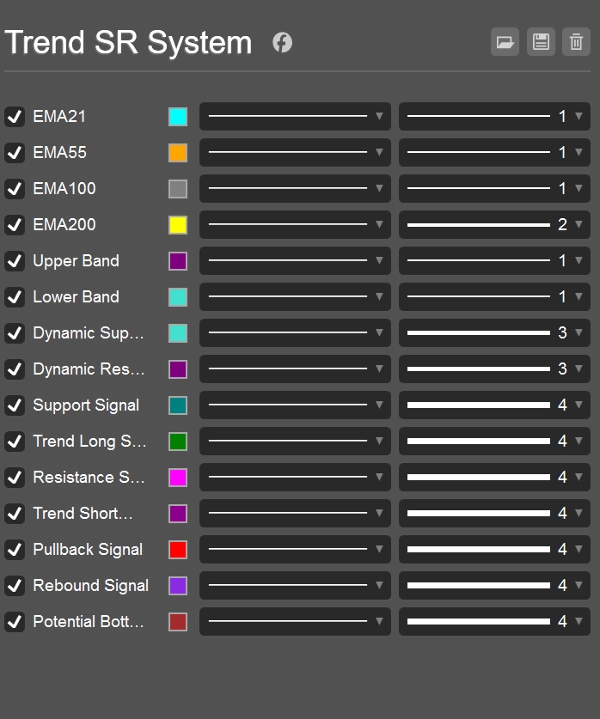
- Displays 4 key EMA structure lines
- Shows upper and lower bands based on ATR or standard deviation
- Generates dynamic support and dynamic resistance levels
- Detects structural support/resistance areas using pivot logic
- Provides continuation-type and short-term correction-type signals
- Allows individual signal types to be turned on or off
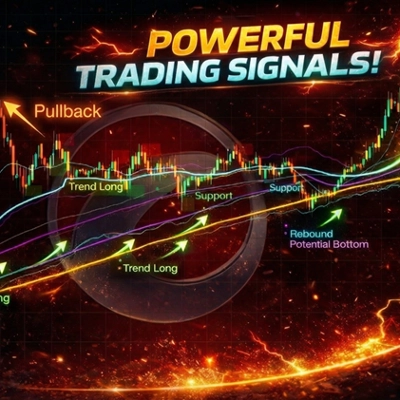
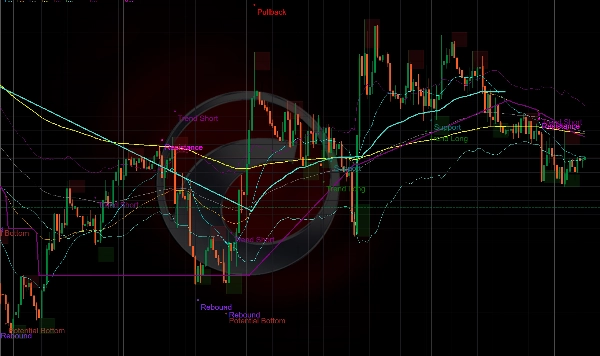
Signal Types
- Support
A key support area in a bullish environment, suggesting that price is being defended after a pullback. - Trend Long
A trend-following long signal in a bullish market, typically appearing after a pullback resumes upward momentum. - Resistance
A key resistance area in a bearish environment, suggesting that price is being capped after a retracement. - Trend Short
A trend-following short signal in a bearish market, typically appearing after a rebound loses strength and the downside trend resumes. - Pullback
A short-term overextended warning in a bullish environment, suggesting possible pullback or consolidation risk. - Rebound
A short-term oversold warning in a bearish environment, suggesting possible technical rebound risk. - Potential Bottom
A stronger oversold recovery-type signal, highlighting a possible attempt at forming a temporary bottom.
Typical Use Cases
This indicator is suitable for:
- Trend-following analysis
- Pullback and retracement entry timing
- EMA structure and support/resistance observation
- Monitoring overextended bullish or bearish conditions
- Chart-based trade filtering and discretionary decision support
It can be used across forex, indices, metals, crypto, and other trending markets.
Best For
This indicator is designed for traders who:
- Want a clearer and more structured chart view
- Focus on trend continuation and key reaction zones
- Use EMA structure together with price behavior and support/resistance
- Prefer visual trading assistance for short- to medium-term setups
Usage Notes
- Best used together with market context and sound risk management
- Signals should not be treated as standalone trading advice
- Signal quality may decline during choppy or low-volatility market conditions
- This is intended as a chart analysis and trade support tool, not a guaranteed-performance system
Summary
Indicator profile
Indicator category
Trend
Output type
Signals
Data requirements
Bars only
Supported signals
Reversal
Breakout
Trend strength
Customer reviews
4.0
Reviews: 1
5 | 0 % | |
4 | 100 % | |
3 | 0 % | |
2 | 0 % | |
1 | 0 % |
Discussion
FAQ
Prop
Forex
Signal
Indices
Supertrend
Commodities
RSI
Crypto
Stocks
ATR
Products available through cTrader Store, including trading bots, indicators and plugins, are provided by third-party developers and made available for informational and technical access purposes only. cTrader Store is not a broker and does not provide investment advice, personal recommendations or any guarantee of future performance.
More from this author


Price
Since 25/03/2026