
Description
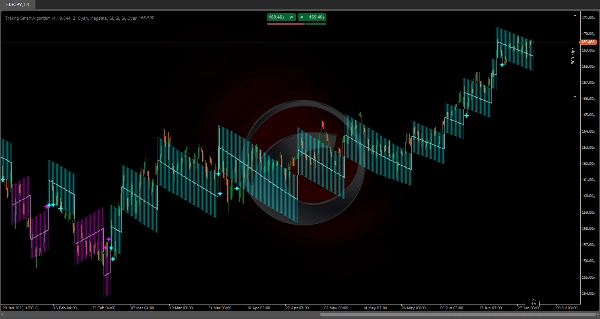
Trailing Smart Algorithm
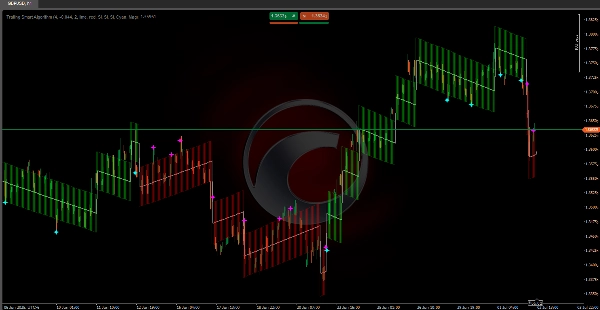
https://chartshots.spotware.com/c/69f0f1d89000b
Incorporates mathematical algorithms 🧠 specifically designed to consistently track price in any market condition 🌐.
Its calculation structure ensures the trendline always stays synchronized with price movements, avoiding the typical lag of traditional indicators ⏳.
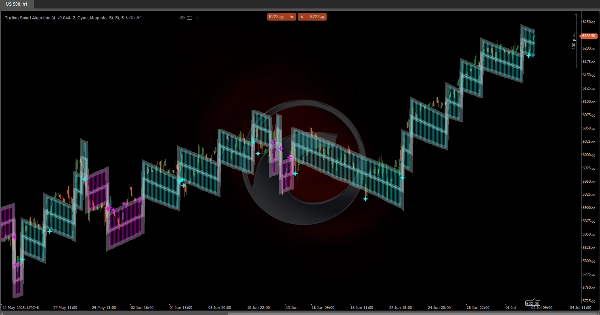
Unlike conventional algorithms, this system uses precise volatility measurements 📊 and applies automatic adjustments ⚙️ that guarantee optimal tracking. Its internal calculations are built to deliver an accurate representation of market direction, maintaining precision during both rapid moves ⚡ and gradual trend development 🕊️.
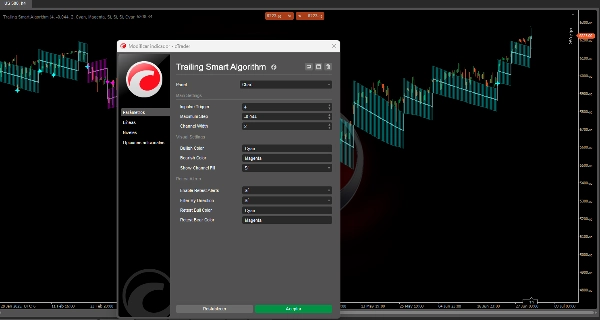
https://chartshots.spotware.com/c/69f0f218591b0
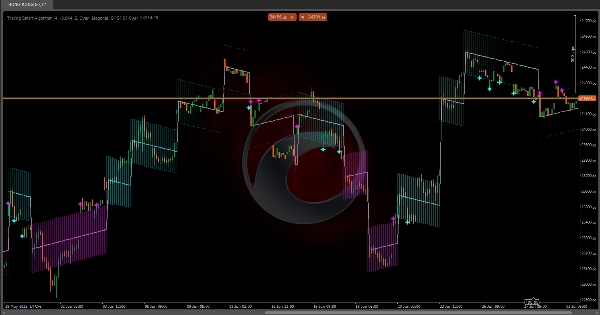
💡 How Does It Work?
The indicator operates using an adaptive step system that moves in the direction of the dominant trend.
It is based on three main components:
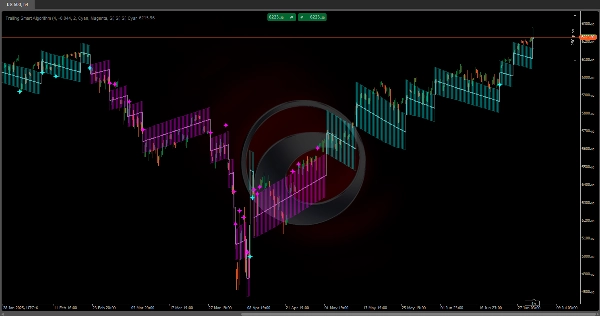
https://chartshots.spotware.com/c/69f0f2b19e4d3
1️⃣ Trend Change Detection
The system continuously monitors price to detect significant movements exceeding a specific threshold (Impulse Trigger 🎯).
When the price moves far enough from the current trendline, the indicator recognizes a potential direction change and repositions its main line.
2️⃣ Dynamic Trailing
Once direction is set, the trendline moves step by step 🪜 in the same direction as the market.
Each step is calculated based on current volatility (ATR 📈):
• In more volatile markets, steps are larger 🌊
• In quieter markets, steps are smaller 🌿
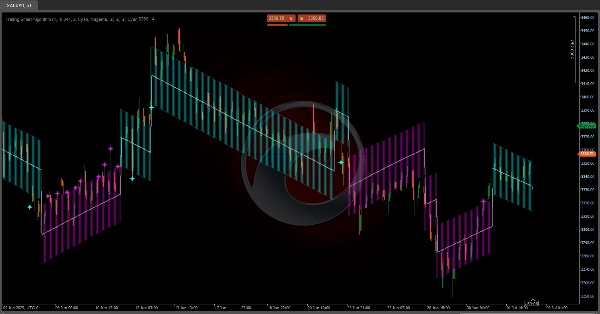
3️⃣ Volatility Channel
A channel forms around the main line (upper and lower bands) representing the normal volatility zone 📉📈.
This channel helps identify whether price is behaving within normal parameters or making extreme moves 🚨.
📏 Volatility Channel
• Upper Band: Upper limit of the volatility channel
• Lower Band: Lower limit of the volatility channel
✨ Retest Signals
• Cyan Stars 🌟: Price touches or crosses the lower band during an uptrend
• Magenta Stars ⭐: Price touches or crosses the upper band during a downtrend
⚙️ Parameter Settings
🔹 Main Parameters
Impulse Trigger (default value: 4)
What does it do?
Determines the sensitivity to detect trend changes. It’s the ATR multiplier defining how much price must move to trigger a direction change.
Impact when modified:
• Higher values (5–8):
- More resistant to trend changes 🛡️
- Fewer false signals
- Slower response to real shifts
• Lower values (2–3):
- Higher sensitivity 🎯
- Faster reaction
- More likely to produce false signals in sideways markets
Maximum Step (default value: -0.044)
What does it do?
Limits the maximum size of each step the trendline can take. It’s a negative value acting as a cap.
Impact when modified:
• Less negative (-0.020 to -0.030):
- Larger steps 🚀
- More aggressive trend tracking
• More negative (-0.050 to -0.080):
- Smaller, more gradual steps 🌱
- More conservative following
Channel Width (default value: 2)
What does it do?
Defines the width of the volatility channel around the main line.
Impact when modified:
• Higher values (3–4):
- Wider channel 🟢
- Fewer retest signals
- Greater tolerance to volatility
• Lower values (1–1.5):
- Narrower channel 🔴
- More retest signals
- More sensitivity to noise
🎨 Visual Parameters
Bullish Color / Bearish Color
Define the colors for uptrends and downtrends respectively.
Show Channel Fill
Enable or disable the visual fill of the volatility channel 🌈.
🔔 Retest Settings
Enable Retest Alerts
Toggle retest signals when price touches the channel bands.
Filter By Direction
When enabled, only shows retest signals matching the current trend:
• In an uptrend: Only signals on the lower band
• In a downtrend: Only signals on the upper band
🌟 Retest Signals Recap
• Cyan Star on Lower Band: Potential bullish bounce from dynamic support ✅
• Magenta Star on Upper Band: Potential bearish bounce from dynamic resistance ❌
Summary
Customer reviews
5 | 100 % | |
4 | 0 % | |
3 | 0 % | |
2 | 0 % | |
1 | 0 % |


