
Description
Pinescriptlabs Store indicators: Pinescriptlabs Store cBots : (cBot) Gold & BTC BreakoutSession Pivots(new)
Prediction Based on Linreg & ATR
SmartTrend Support &
Resistance
Lines
Dynamic
Market Structure
Analysis
of
Turning
Points
Fibonacci
Linear
Regression
Multi-timeframe
Auto
Support and
Resistance
Trend
Lines
All
Support and
Resistance
Levels
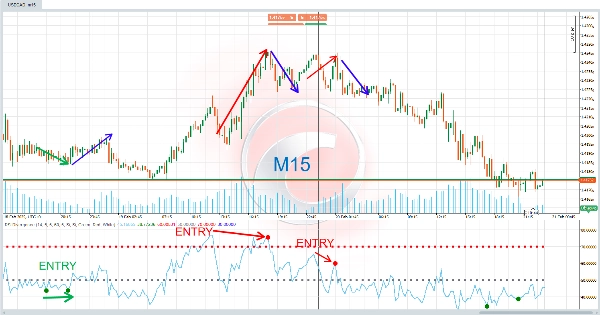
The RSI Divergence is an advanced technical analysis tool designed to detect divergences between price and the Relative Strength Index (RSI) . These divergences are powerful signals that can anticipate changes in market direction, making it an invaluable resource for technical traders. 🔍💡
⚙️ How Does It Work?
This indicator operates on the principle that price and RSI don’t always move in sync. When a divergence occurs, it means the price is sending a signal contrary to the underlying RSI trend. This can be an early warning that the current trend might be losing strength.
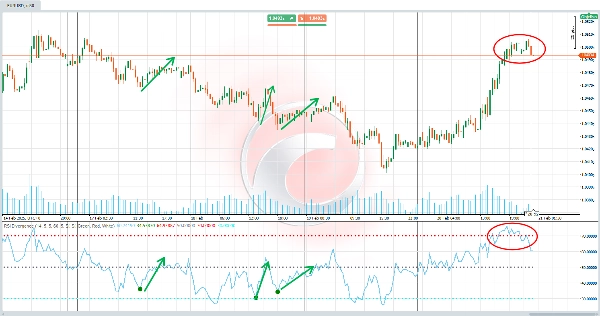
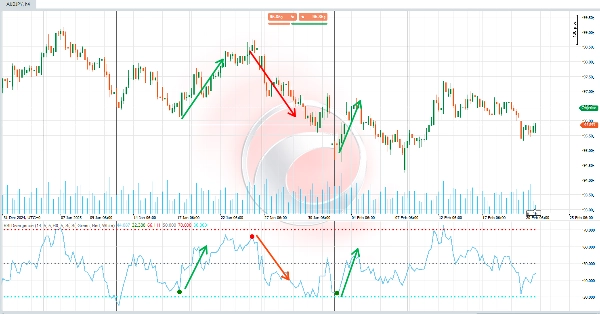
- Bullish Divergence (Uptrend) 📈 :
Occurs when the price forms lower lows , but the RSI forms higher lows . This suggests that, although the price is falling, upward momentum might be gaining ground, potentially leading to an upward reversal. ✅ - Bearish Divergence (Downtrend) 📉 :
Occurs when the price forms higher highs , but the RSI forms lower highs . This suggests that, although the price is rising, downward momentum might be gaining ground, potentially leading to a downward reversal. ❌
The indicator automatically detects these divergences and highlights them on the chart with colors, lines, and labels for easy interpretation. 🎯
💡 What Is It Used For?
This indicator is especially useful for:
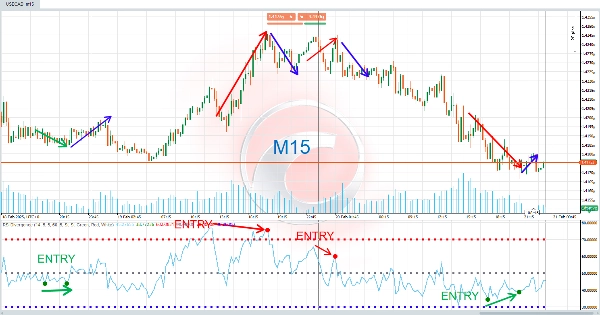
- Identifying entry and exit points : Divergences can act as buy (bullish) or sell (bearish) signals. 🛒💸
- Anticipating trend changes : Divergences are early signals that the current trend might be losing strength. ⚡
- Confirming technical analysis : It can be used alongside other indicators or candlestick patterns to validate trading decisions. 🧠📊
It’s ideal for both intraday traders and long-term investors, as divergences apply to any timeframe. ⏳📈
🛠️ How to Use It?
- Initial Setup:
- Customize parameters according to your needs, such as the RSI period, pivot search ranges, and signal colors. 🎨⚙️
- Enable or disable the display of bullish or bearish divergences based on your preferences. ✅❌
- Interpreting Signals:
- Bullish Divergence : When a green "D" signal appears on the chart, it indicates a possible buying opportunity. 🟩🛒
- Bearish Divergence : When a red "D" signal appears on the chart, it indicates a possible selling opportunity. 🟥🚫
- Additionally, lines connecting the divergence points are drawn to facilitate visual analysis. 📐🔗
- Decision Making:
- Use these signals to adjust your strategies, such as opening positions, closing existing trades, or adjusting stop-loss levels. 🤝💼
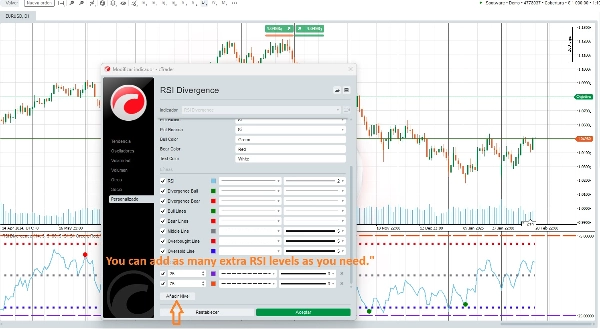
🆕 Advanced Customization!
🌟 You can add as many RSI levels as the user wants 🌟
This indicator allows you to fully customize your trading experience. You can add multiple RSI levels to adapt it to different strategies and trading styles. For example, you can configure additional overbought and oversold levels or even adjust the RSI period to suit different timeframes. 🔄📈📉
Summary
Designed for use on any timeframe, the indicator helps traders identify entry and exit points, anticipate trend changes, and confirm other technical analysis signals. Users can customize parameters such as RSI period, pivot search ranges, signal colors, and enable or disable specific divergence types. Additionally, multiple RSI levels can be added to tailor the indicator to various trading strategies and styles.
This tool is suitable for intraday traders and long-term investors across markets including cryptocurrencies (e.g., BTCUSD), commodities (e.g., gold, XAUUSD), and indices. It supports enhanced decision-making by providing early warnings of trend strength shifts based on RSI divergence analysis.
Customer reviews
5 | 0 % | |
4 | 100 % | |
3 | 0 % | |
2 | 0 % | |
1 | 0 % |


