"Trend Heikin Multi MA" โลโก้
อินดิเคเตอร์
5 การซื้อ
เวอร์ชัน 1.0, Apr 2025
Windows, Mac
4.3
รีวิว: 3
"Trend Heikin Multi MA" ภาพที่อัปโหลด
ตั้งแต่ 03/10/2024
152
การขาย
35.54K
ติดตั้งฟรี

📊 TrendHeikinMultiMA – อัลกอริทึมแนวโน้มขั้นสูง

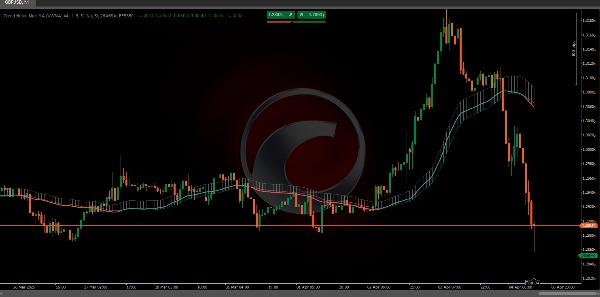
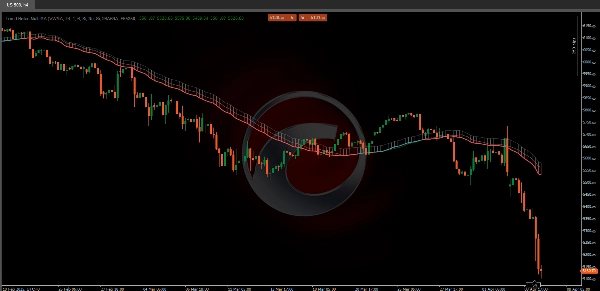
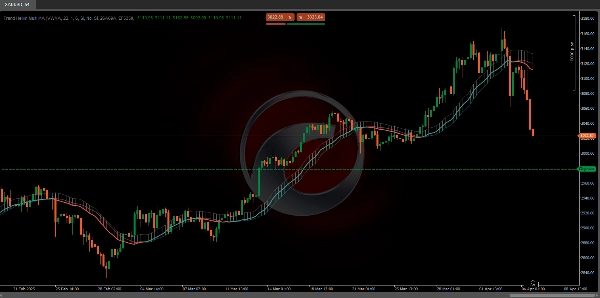
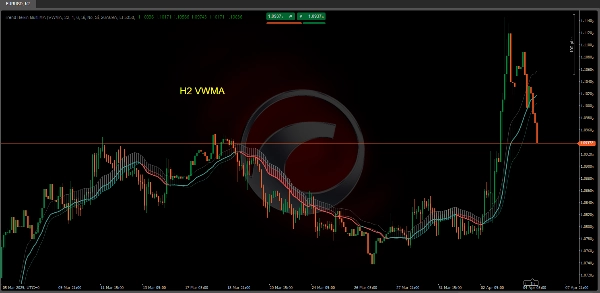
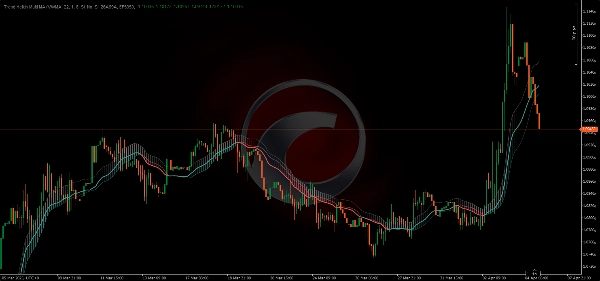
อัลกอริทึม TrendHeikinMultiMA ถูกออกแบบมาเพื่อคำนวณ ค่าของแนวโน้ม จากข้อมูลราคา โดยใช้ สูตร Heikin-Ashi เพื่อปรับค่าเหล่านี้ให้เรียบขึ้นและใช้ค่าเฉลี่ยเคลื่อนที่ประเภทต่าง ๆ (ALMA, HMA, SMA, SWMA, VWMA, WMA, ZLEMA, หรือ EMA)

แม้ว่า ค่าของ Heikin-Ashi จะถูกใช้ภายใน แต่กราฟจะไม่แสดงแท่งเทียน Heikin-Ashi แบบดั้งเดิม แต่จะวาด เส้นแนวโน้ม ตามค่าที่ปรับเรียบ ทำให้การตีความทิศทางตลาดง่ายขึ้น โดยไม่มีความซับซ้อนทางสายตาของกราฟแท่งเทียน.


🔄 1. บทบาทของการปรับเรียบ

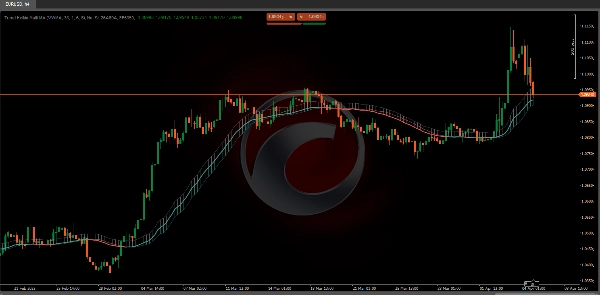
เนื่องจากค่าของแนวโน้มได้มาจาก การปรับเรียบแบบ Heikin-Ashi ร่วมกับค่าเฉลี่ยเคลื่อนที่, การเปลี่ยนสี ใน TrendHeikinMultiMA จะไม่เกิดขึ้นทันที เมื่อราคาตัดผ่านเส้นแนวโน้ม:

  • 🔹 ราคาอาจเคลื่อนไหวชั่วคราว เหนือหรือใต้ เส้นแนวโน้ม โดยไม่ทำให้เกิดการเปลี่ยนสี.
  • 🔹 เหตุการณ์นี้เกิดขึ้นเพราะตัวชี้วัด รอการเปลี่ยนแปลงที่สำคัญและต่อเนื่อง ระหว่าง ค่าปรับเรียบของราคาเปิดและปิด เพื่อยืนยันการกลับตัวของแนวโน้มจริงๆ.

ข้อได้เปรียบในการตีความ

การ หน่วงเวลาที่ตั้งใจนี้ ในการเปลี่ยนสีช่วย หลีกเลี่ยงสัญญาณเท็จ ในกราฟแท่งเทียนแบบดั้งเดิม, ราคาสามารถตัดผ่านเส้นแนวโน้มชั่วคราวและทำให้เกิดสัญญาณก่อนเวลาอันควรได้.

  • 🟥 ตัวอย่างเช่น แม้ว่าราคาปัจจุบันจะอยู่เหนือเส้นแนวโน้มขาลง ตัวชี้วัดจะยังคงเป็น สีแดง (ขาลง) จนกว่าค่าปรับเรียบจะยืนยันว่า ราคาปิดสูงกว่าราคาเปิดอย่างสม่ำเสมอ.
  • 🟩 เช่นเดียวกัน, เพื่อเปลี่ยนเป็น สีเขียว (ขาขึ้น) ค่าเฉลี่ยเคลื่อนที่ที่อิง Heikin-Ashi ต้องยืนยันว่า ราคาปิดสูงกว่าราคาเปิดอย่างสม่ำเสมอ.


📈 2. การใช้ค่าเฉลี่ยเคลื่อนที่กับค่าของ Heikin-Ashi

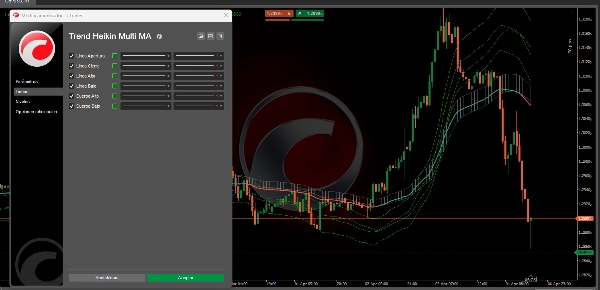
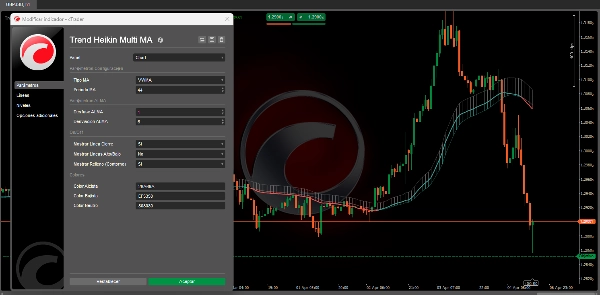
  • 🔄 การเลือกค่าเฉลี่ยเคลื่อนที่:
    • ผู้ใช้สามารถ เลือกประเภทค่าเฉลี่ยเคลื่อนที่ต่าง ๆ (ALMA, HMA, SMA, SWMA, VWMA, WMA, ZLEMA, และ EMA)
    • แต่ละประเภท MA ใช้วิธีทางคณิตศาสตร์เฉพาะ เพื่อถ่วงน้ำหนักและปรับเรียบค่าประวัติของ ราคาเปิด, ปิด, สูง, และต่ำ ที่ได้จาก Heikin-Ashi.


🏆 3. ข้อดีของการใช้ TrendHeikinMultiMA เทียบกับแท่งเทียนแบบดั้งเดิม

  • 📉 การลดเสียงรบกวน:
    • แท่งเทียนแบบดั้งเดิมมักแสดง ความผันผวนสูงและข้อมูลกระจัดกระจาย ทำให้ยากต่อการระบุแนวโน้มโดยรวม.
    • TrendHeikinMultiMA ปรับเรียบข้อมูลนี้ กรองความผันผวนเล็กน้อยและกำจัดการแกว่งอย่างฉับพลัน, ช่วยให้เทรดเดอร์มุ่งเน้นไปที่ทิศทางหลักของตลาด.


บทสรุป

โดยสรุป, TrendHeikinMultiMA ยืนยันการเปลี่ยนแปลงแนวโน้ม (ขาขึ้นหรือขาลง) ก็ต่อเมื่อ ค่าปรับเรียบของราคาเปิดและปิด—ซึ่งคำนวณจาก Heikin-Ashi และผ่านการประมวลผลด้วย ค่าเฉลี่ยเคลื่อนที่ที่เลือกแสดงอย่างสม่ำเสมอ ว่าพฤติกรรมตลาดได้ กลับทิศทางแล้ว.

สิ่งนี้ช่วยให้ สัญญาณมีความน่าเชื่อถือมากขึ้น และได้รับผลกระทบน้อยลงจากเสียงรบกวนที่เห็นในกราฟแท่งเทียนแบบดั้งเดิม 🚀📊


🔥  Pinescritlabs Ctrader Store indicators  🔥

Fair Value Gap Sessions

ZigZag

 BOS & CHOCH

Channel Breakout System

Supertrend

Market Imbalance

Adaptive Trend Channel 

Dynamic Market Structure
Analysis of Turning Points

Order Block

Fibonacci Linear
Regression Multi-timeframe

Volume POC Heatmap

Dynamic RSI

Momentum Fair Value Gap

Market Flow Projection

Dynamic Trend Gradient

Multi-Level Candle Bias
Tracker

Zig-Zag Extremity Tracker

Reactive Moving Average

Auto-Trend Channel

Auto Support and
Resistance Trend Lines

All Support and
Resistance Levels

Leverage Liquidation Map

Zones Supply Demand

Dynamic Range Momentum


โปรไฟล์อินดิเคเตอร์
4.3
รีวิว: 3
5
33 %
4
67 %
3
0 %
2
0 %
1
0 %
รีวิวจากลูกค้า
April 7, 2025
Useful plan helper around moving average setups. The useful part is checking direction and filtered momentum, with the numbers checked before scaling. I would compare 10, 20 and 50 MA behavior before using it with real size. The signal is clearer when the stop and target still give at least 1.5R.
April 6, 2025
April 6, 2025
Careful market layer if the trader wants it makes trend and smoothing logic easier to follow. It works best as support, not a final decision maker. The MA read feels better when 20 and 50 period context agree across 2 timeframes. MAs can lag when price turns fast.
Breakout
Supertrend
RSI
ผลิตภัณฑ์ที่มีให้บริการผ่าน cTrader Store รวมถึงบอทการเทรด อินดิเคเตอร์ และปลั๊กอิน มีให้บริการโดยนักพัฒนาบุคคลที่สามและมีไว้เพื่อวัตถุประสงค์ในการเข้าถึงข้อมูลและทางเทคนิคเท่านั้น cTrader Store ไม่ใช่โบรกเกอร์และไม่ได้ให้คำแนะนำการลงทุน คำแนะนำส่วนบุคคล หรือการรับประกันผลการดำเนินงานในอนาคต

เพิ่มเติมจากผู้เขียนคนนี้

"ZigZag" โลโก้
เรตติ้งสูง
4.3
(6)
ฟรี
อินดิเคเตอร์
ATR
RSI
+7
ZigZag filters noise, spots trends, patterns, pivots, aiding analysis, trade management, and confirmations. 📉📈
"Order Block" โลโก้
ยอดนิยม
5.0
(4)
$19
อินดิเคเตอร์
ATR
RSI
+7
Identify bullish and bearish Order Blocks to spot key support/resistance levels and potential trend reversals! 📈🔄
"Volume POC Heatmap" โลโก้
เรตติ้งสูง
5.0
(4)
ฟรี
อินดิเคเตอร์
ATR
RSI
+7
📊 Shows volume by price levels, highlights POC, and key zones. Identifies dynamic support/resistance and imbalances.
"BOS & CHOCH" โลโก้
ยอดนิยม
5.0
(2)
$19
/
$25
อินดิเคเตอร์
ATR
RSI
+6
Market structural patterns , specifically the concepts of Change of Character (ChoCH) 🔄 and Break of Structure (BoS) 💥
"Auto-Trend Channel" โลโก้
เรตติ้งสูง
4.4
(5)
ฟรี
อินดิเคเตอร์
ATR
RSI
+6
Adaptive trend channel using linear regression and Pearson correlation for dynamic support, resistance, and trends.
อินดิเคเตอร์
RSI
Breakout
+1
"Identify key market zones and visualize support/resistance from multiple timeframes on a single chart.
"Fair Value Gap Sessions" โลโก้
เรตติ้งสูง
5.0
(4)
ฟรี
อินดิเคเตอร์
ATR
RSI
+7
identify and highlight temporary market inefficiencies known as "fair value gaps" 🚨 within specific trading Sessions.
"Supertrend" โลโก้
ยอดนิยม
4.3
(3)
$19
อินดิเคเตอร์
ATR
RSI
+6
💹 Define a price channel 📈 and determine trend direction (bullish 🟢 or bearish 🔴).
อินดิเคเตอร์
ATR
RSI
+6
📊Zones Supply & Demand: Identifies key price levels with high volume concentration, marking Supply/Demand Zones & Marke
อินดิเคเตอร์
RSI
BTCUSD
+5
Identify market structure effortlessly with swing highs, lows, CHoCH, and BOS levels for smart trading decisions! 📊🔍"
อินดิเคเตอร์
ATR
RSI
+8
Detects bullish and bearish divergences
อินดิเคเตอร์
Advanced price action tool that combines multiple technical analysis concepts

นอกจากนี้คุณยังอาจชอบ

อินดิเคเตอร์
Fibonacci
Key Levels
DailyTargets: Dynamic ADR-based levels & targets. Includes Buy/Sell zones, previous Hi/Lo, and automated trend alerts.
อินดิเคเตอร์
RSI
BTCUSD
+5
Identify market structure effortlessly with swing highs, lows, CHoCH, and BOS levels for smart trading decisions! 📊🔍"
อินดิเคเตอร์
ADX
ATR
+5
Identifies TRENDING, RANGING and VOLATILE markets with pullback detection. Anti-noise filter. Works on ANY chart.
"LT_Ind_Candles" โลโก้
ยอดนิยม
4.0
(1)
$19
อินดิเคเตอร์
ATR
Forex
+5
Most used candle patterns. (1 candle, 2 candles and 3 candles patterns) and Marubozu. Bonus Fibo Risk control.
"Series - FXMaster" โลโก้
ยอดนิยม
4.6
(3)
$19
อินดิเคเตอร์
Forex
Crypto
+3
Consecutive Series Moves — Reveal the True Pulse of Price Action
"Trend Sniper" โลโก้
ยอดนิยม
4.5
(2)
$19
/
$29
อินดิเคเตอร์
Prop
Forex
+9
Trend Sniper — session-based tool highlighting live session ranges and adaptive Custom line.
อินดิเคเตอร์
Volume
Order Block
+4
Volume Profile with fixed period, custom range and buy/sell pressure.
อินดิเคเตอร์
Signal
Order Flow Market Depth Pro | Footprint & DOM
อินดิเคเตอร์
Moving Average
An Indicator made for scalping. Shows you the Sniper movement on Chart with the colour signals.
อินดิเคเตอร์
Block Liquidity,indicator.Block Order, Liquids Stops, Signal Sentiment,signal correctio.
"QX TradeDecision" โลโก้
ใหม่
4.5
(2)
$20
/
$22
อินดิเคเตอร์
ATR
Flag
+5
Decision panel with Buy/Sell scores, market bias, setup quality, trading cost and clear trade reasons.
อินดิเคเตอร์
VWAP
Volume Weighted Average Price (VWAP)
อินดิเคเตอร์
Prop
Forex
+6
Elliott Wave Structure Pro v2.0 (Non-Repainting) Structure, Elliott, Continuation Entries
"QX Heatmap Scanner" โลโก้
ยอดนิยม
4.3
(3)
$19
/
$38
อินดิเคเตอร์
ATR
RSI
+19
Multi-timeframe heatmap scoring Direction, Strength & Volatility at a glance!
อินดิเคเตอร์
Key Levels
Supply & Demand
+2
Institutional Levels Pro is an essential tool for traders who rely on price action and institutional market structure.
อินดิเคเตอร์
Key Levels
Support & Resistance
Renko Multi-Level Grid Overlay draws configurable horizontal grid lines on any chart type, for multi-timeframe analysis.
อินดิเคเตอร์
SMC
Forex
+5
Pinpoint FVGs, track fills and see mitigation stats — trade imbalances with clarity and confidence.
อินดิเคเตอร์
SMC
Signal
+2
Gold Market Maker Zones; Non-repainting Supply & Demand detector for XAUUSD. Precise institutional zones for cTrader.
ตั้งแต่ 03/10/2024
152
การขาย
35.54K
ติดตั้งฟรี