
KDJ
อินดิเคเตอร์
255 ดาวน์โหลด
เวอร์ชัน 1.0, Dec 2024
Windows, Mac
5.0
รีวิว: 1
คำอธิบาย
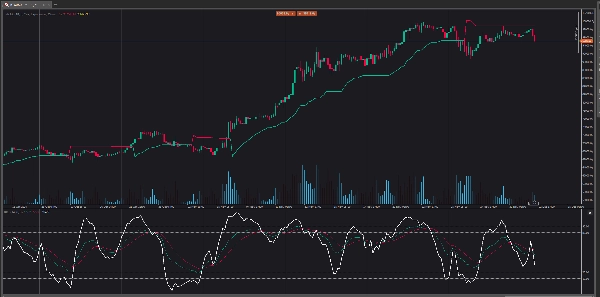
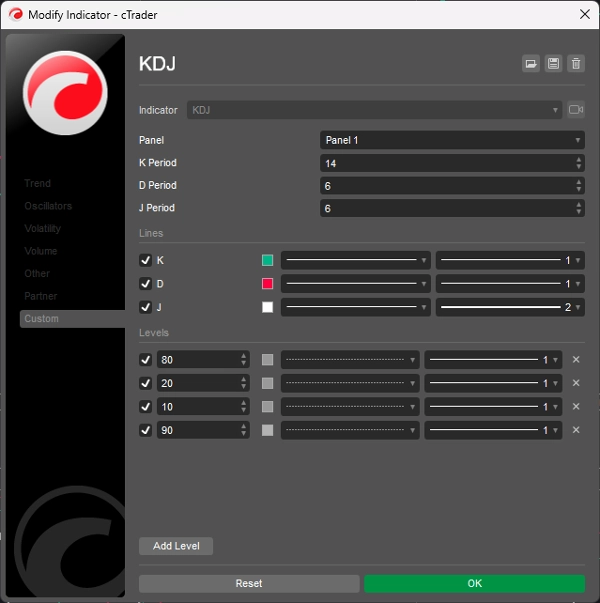
จอแสดงผล KDJ oscillator ประกอบด้วยเส้น 3 เส้น (K, D และ J - ดังนั้นชื่อของจอแสดงผล) และระดับ 2 ระดับ K และ D เป็นเส้นเดียวกันเมื่อใช้ stochastic oscillator เส้น J แสดงถึงความเบี่ยงเบนของค่าของ D จากค่า K การบรรจบกันของเส้นเหล่านี้บ่งชี้โอกาสการซื้อขายใหม่ เช่นเดียวกับ Stochastic Oscillator ระดับที่ขายเกินและซื้อมากเกินไปสอดคล้องกับช่วงเวลาที่แนวโน้มมีแนวโน้มจะกลับตัว
สรุป
สรุปโดย AI
The KDJ indicator is an oscillator consisting of three lines: K, D, and J, along with two reference levels. The K and D lines correspond to those used in the stochastic oscillator, while the J line measures the deviation of the D value from the K value. This convergence of the three lines is used to identify potential new trading opportunities. Similar to the stochastic oscillator, the KDJ indicator highlights overbought and oversold conditions, which often signal possible trend reversals. This tool is designed to assist traders in timing entries and exits by analyzing momentum and trend strength through these oscillating lines.
โปรไฟล์อินดิเคเตอร์
รีวิวจากลูกค้า
5.0
รีวิว: 1
5 | 100 % | |
4 | 0 % | |
3 | 0 % | |
2 | 0 % | |
1 | 0 % |
รีวิวจากลูกค้า
August 18, 2025
Pros: Three-line stochastic oscillator (K, D, J) that identifies overbought/oversold levels and momentum shifts. Supports divergence analysis and crossovers between K and D as trading signals. Lightweight and responsive. Cons: No alerts, tooltips, or settings presets. J‑line can generate outlier v
การสนทนา
คำถามที่พบบ่อย
ผลิตภัณฑ์ที่มีให้บริการผ่าน cTrader Store รวมถึงบอทการเทรด อินดิเคเตอร์ และปลั๊กอิน มีให้บริการโดยนักพัฒนาบุคคลที่สามและมีไว้เพื่อวัตถุประสงค์ในการเข้าถึงข้อมูลและทางเทคนิคเท่านั้น cTrader Store ไม่ใช่โบรกเกอร์และไม่ได้ให้คำแนะนำการลงทุน คำแนะนำส่วนบุคคล หรือการรับประกันผลการดำเนินงานในอนาคต


ราคา
2
การขาย
6.89K
ติดตั้งฟรี