
คำอธิบาย
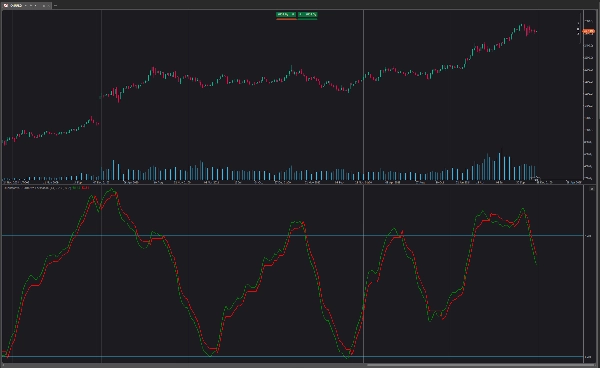
QQE (Quantitative Qualitative Estimation) Weighted Oscillator ปรับปรุงจากเวอร์ชันเดิมโดยการให้น้ำหนัก RSI ตามสัญญาณที่ได้จาก trailing stop ซึ่งต้องใช้ความพยายามมากขึ้นเพื่อให้เกิดการตัดกันกับ trailing stop QQE Weighted Oscillator ประกอบด้วย oscillator RSI ที่ผ่านการปรับค่าเรียบและ trailing stop ที่ได้มาจาก RSI เดียวกันนี้
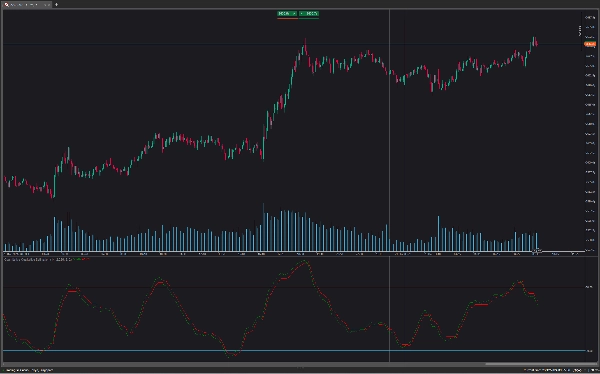
oscillator นี้สามารถใช้บ่งชี้ได้ว่าตลาดอยู่ในภาวะซื้อมาก/ขายมากเกินไป รวมถึงเป็นสัญญาณเบื้องต้นของการกลับตัวของแนวโน้มเนื่องจากลักษณะนำของ RSI
การใช้ค่า Factor ที่สูงขึ้นจะทำให้ได้ trailing stop ที่มีระยะเวลานานขึ้น
เช่นเดียวกับ RSI ปกติ การเบี่ยงเบนสามารถบ่งชี้การกลับตัวได้
การให้น้ำหนักเพิ่มเติมจะควบคุมว่าต้องใช้ "ความพยายาม" มากแค่ไหนเพื่อให้ trailing stop ตัดกับ RSI ตัวอย่างเช่น RSI ที่สูงกว่า trailing stop จะต้องการการเปลี่ยนแปลงราคาลบในระดับที่สูงขึ้นเพื่อให้เกิดการตัดกันเมื่อใช้ค่าน้ำหนักที่สูงขึ้น
สิ่งนี้อาจทำให้การให้น้ำหนักที่สูงขึ้นส่งผลลัพธ์ที่มีลักษณะเป็นวัฏจักรและเรียบเนียนมากขึ้น
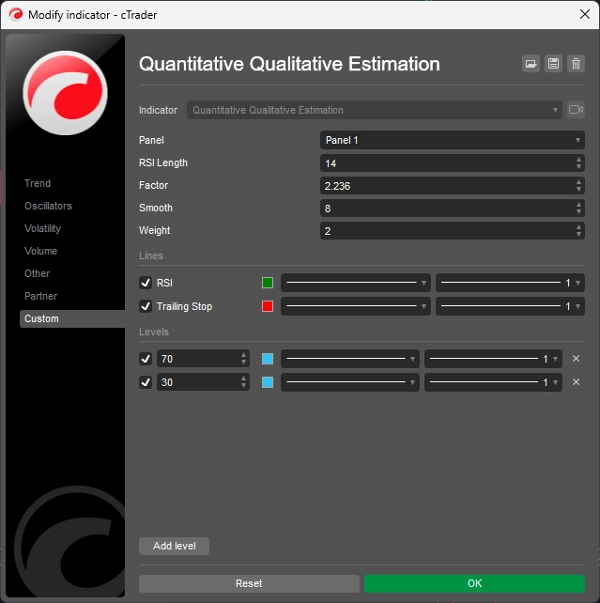
วิธีการเปลี่ยนการตั้งค่า:
- Length: ความยาวของ oscillator RSI
- Factor: ตัวคูณที่ใช้สำหรับการคำนวณ trailing stop
- Smooth: ระดับความเรียบเนียนของ oscillator RSI
- Weight: ระดับการให้น้ำหนักที่ใช้สำหรับการคำนวณ RSI
สรุป
รีวิวจากลูกค้า
5 | 100 % | |
4 | 0 % | |
3 | 0 % | |
2 | 0 % | |
1 | 0 % |


!["[Hamster-Coder] Price" โลโก้](https://cdn.ctrader.com/image/webp/893fb641-d5b3-44d8-91fb-6a2dc6f3d309_30647)