
Penerangan
Penunjuk LIKUIDITI BLOK menggabungkan dua pendekatan utama untuk analisis pasaran:
Pengesanan Blok Pesanan:
Mengenal pasti kawasan sokongan dan rintangan berdasarkan paras tertinggi dan terendah yang tidak pecah dalam tempoh tinjauan.
Menghasilkan isyarat beli apabila harga ditutup di atas paras terendah yang tidak pecah.
Menghasilkan isyarat jual apabila harga ditutup di bawah paras tertinggi yang tidak pecah.
Analisis Likuiditi:
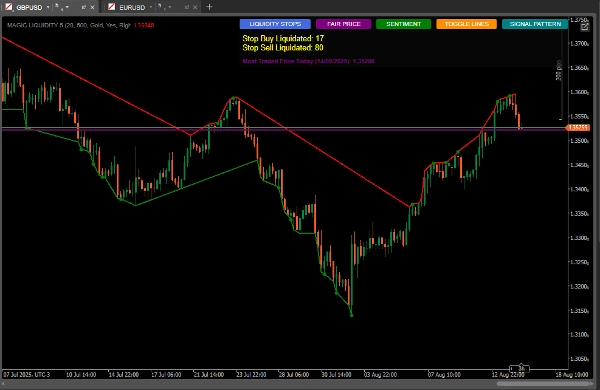
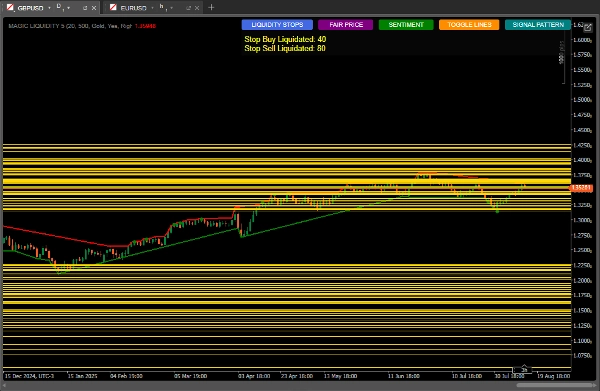
Mengesan kolam likuiditi (kawasan di mana stop loss mungkin terkumpul).
Memantau pengaktifan stop beli dan jual.
Mengira sentimen pasaran berdasarkan pengagihan likuiditi.
Mengenal pasti harga yang paling banyak didagangkan (harga adil).
Cara Menggunakan untuk Keputusan Terbaik
Konfigurasi Awal
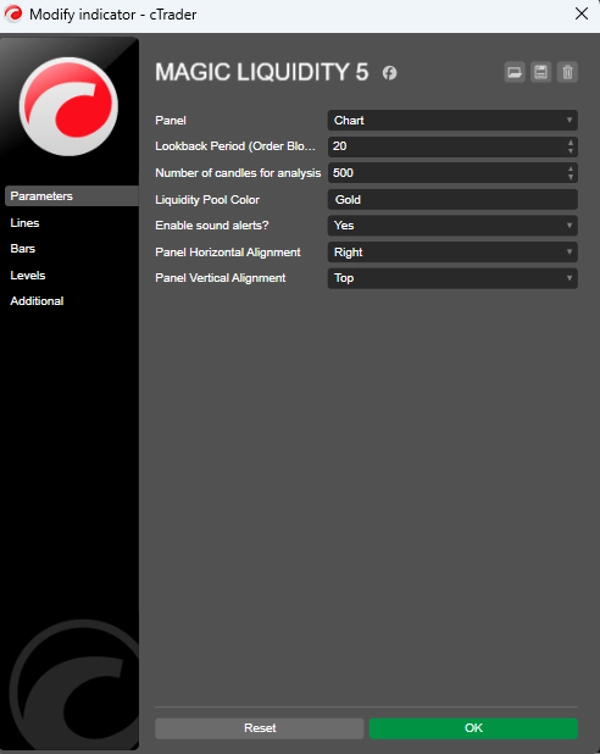
Tempoh Tinjauan: Laraskan parameter "Tempoh Tinjauan" mengikut jangka masa yang anda dagangkan (nilai lebih tinggi untuk jangka masa lebih tinggi).
Bilangan Lilin untuk Analisis: Kekalkan pada 500 untuk analisis yang kukuh atau kurangkan untuk tindak balas yang lebih pantas.
Warna Kolam Likuiditi: Pilih warna yang menonjol pada carta anda.
Tafsiran Isyarat
Isyarat Blok Pesanan:
Titik hijau: Isyarat beli apabila harga ditutup di atas paras terendah yang tidak pecah.
Titik merah: Isyarat jual apabila harga ditutup di bawah paras tertinggi yang tidak pecah.
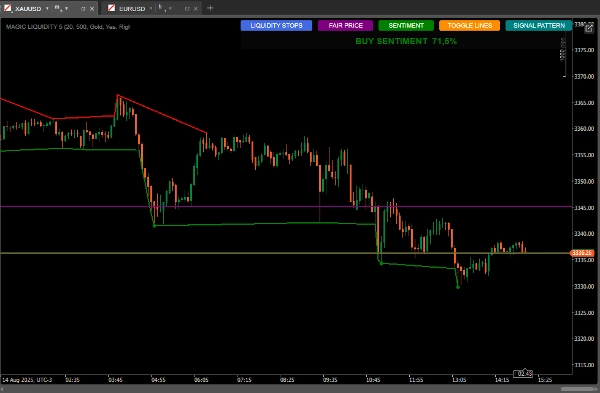
Kolam Likuiditi:
Garis mendatar menunjukkan kawasan likuiditi (sasaran potensi atau titik pembalikan).
Pantau hubungan antara likuiditi di atas/bawah harga semasa.
Sentimen Pasaran:
Gunakan butang "SENTIMENT" untuk melihat arah dan keyakinan yang dominan.
Sentimen beli dengan keyakinan tinggi mencadangkan pertumbuhan berterusan. Sentimen jual dengan keyakinan tinggi mencadangkan kesinambungan bearish.
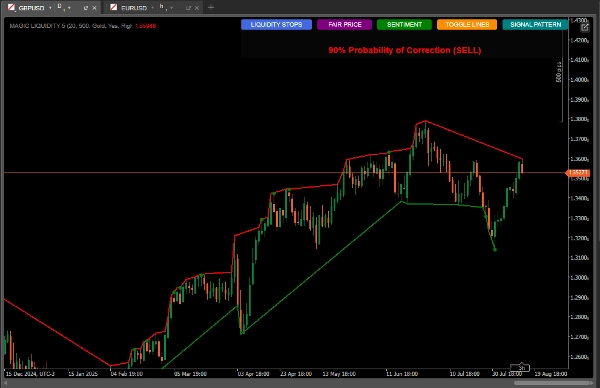
Corak Lilin:
Butang "SIGNAL PATTERN" menganalisis dan
Menunjukkan kebarangkalian pembetulan berdasarkan nisbah kuantitatif
Harga Paling Banyak Didagangkan (Harga Adil):
Butang "FAIR PRICE" menunjukkan tahap harga dengan jumlah volum tertinggi hari itu.
Ia boleh bertindak sebagai magnet untuk harga atau sebagai sokongan/rintangan.
Strategi Penggunaan
Strategi Konservatif:
Berdagang hanya apabila isyarat blok pesanan sejajar dengan sentimen dominan.
Gunakan kolam likuiditi sebagai sasaran ambil untung.
Strategi Agresif:
Jangka pembalikan apabila harga menghampiri kolam likuiditi dengan banyak stop terkumpul.
Gunakan perbezaan antara sentimen dan tindakan harga untuk dagangan menentang trend.
Pengesahan Tambahan:
Bandingkan dengan corak lilin yang ditunjukkan oleh penunjuk.
Periksa jika harga adil berada berhampiran sebagai kawasan minat.
Pengurusan Risiko.
Stop-Loss:
Letakkan di bawah blok pesanan terkini untuk pembelian
Letakkan di atas blok pesanan terkini untuk penjualan
Take-Profit:
Sasaran dalam kolam likuiditi berhampiran
Pertimbangkan nisbah likuiditi atas/bawah untuk menetapkan sasaran
Petua Lanjutan
Gunakan butang "TOGGLE LINES" untuk mematikan garis likuiditi apabila carta menjadi sesak
Pantau kiraan stop yang dilikuidasi untuk menilai kekuatan pergerakan
Harga adil sangat berguna dalam pasaran terikat julat seperti sokongan/rintangan dinamik
Gabungkan dengan penunjuk lain untuk pengesahan (volum, purata bergerak)
Volum penunjuk:
https://ctrader.com/pt/products/635
Ringkasan
Users can customize parameters such as lookback period and number of candles analyzed to suit different timeframes and trading styles. Visual signals include green and red dots for buy and sell order block signals, and horizontal lines marking liquidity pools. Additional features include sentiment indication with confidence levels, candlestick pattern analysis for correction probabilities, and toggling of liquidity lines for chart clarity.
Recommended strategies include trading in the direction of order block signals aligned with sentiment for conservative approaches, or anticipating reversals near liquidity pools for aggressive trades. Risk management is supported by placing stop-loss orders relative to recent order blocks and setting take-profit targets at liquidity pools. The indicator can be combined with other tools like volume and moving averages for confirmation.
Ulasan pelanggan
5 | 100 % | |
4 | 0 % | |
3 | 0 % | |
2 | 0 % | |
1 | 0 % |


