present
Zarejestruj się i otrzymaj 50 $ zniżki na pierwszy zakup
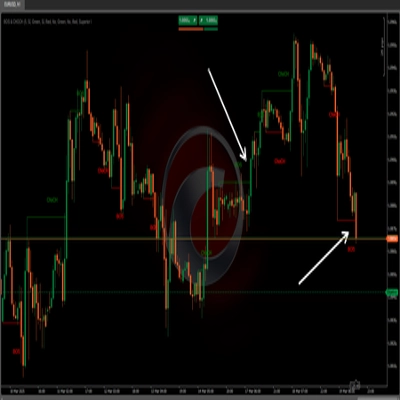
Trading product for CVD Wskaźnik Signal, image 1
CVD
Wskaźnik
3 zakupy
Wersja 1.0, Dec 2025
Windows, Mac
4.6
Opinie: 3
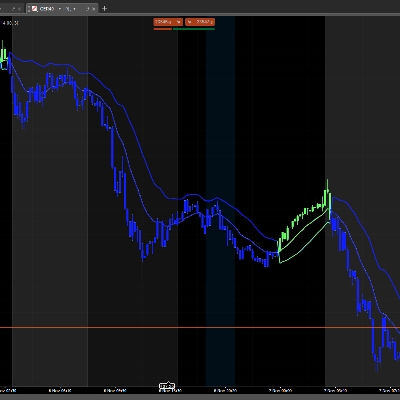
Trading product for CVD Wskaźnik Signal, image 2
Od 29/06/2025
2
Sprzedaż
13
Bezpłatne instalacje

Opis

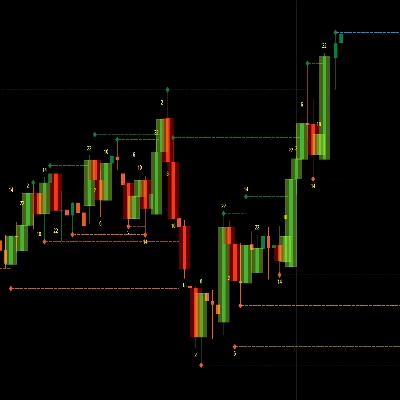
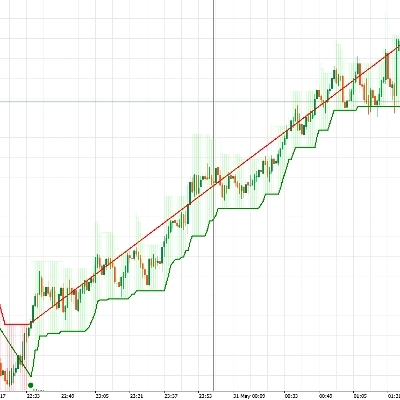
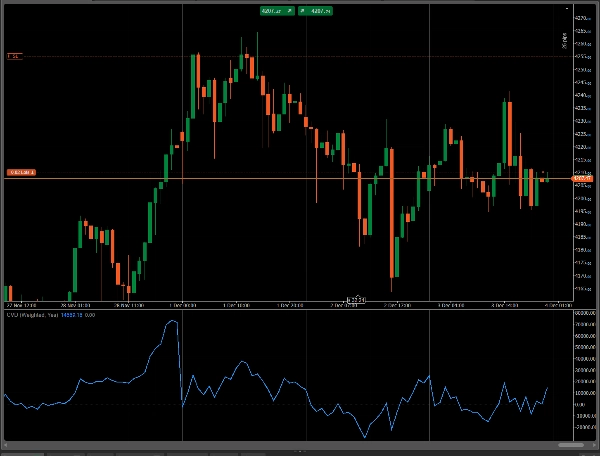
Cumulative Volume Delta to wskaźnik handlowy, który śledzi netto różnicę między presją kupna a sprzedaży w czasie poprzez kumulowanie danych o wolumenie

Podsumowanie

Podsumowanie AI
Cumulative Volume Delta (CVD) is a trading indicator that measures the net difference between buying and selling pressure by accumulating tick volume data over time. It tracks the balance of volume traded at the bid and ask prices to provide insight into market sentiment and potential price movements. This indicator helps traders identify shifts in supply and demand dynamics by highlighting whether buying or selling activity dominates during a given period. CVD is used as a signal tool to support trade entry decisions based on volume analysis.
Profil wskaźnika

Dyskusja

Opinie klientów

4.6
Opinie: 3
5
67 %
4
33 %
3
0 %
2
0 %
1
0 %
Opinie klientów
December 12, 2025
A calm trader gets value from the entry feels calmer, and a week of notes gives a better read.
December 11, 2025
Works better when the trader stays patient. 20 reactions is a fair first sample.
December 7, 2025
The click feels less impulsive, but it should not replace the chart.

Częste pytania

Signal
Produkty dostępne za pośrednictwem cTrader Store, w tym boty handlowe, wskaźniki i wtyczki, dostarczane są przez deweloperów zewnętrznych i udostępniane wyłącznie w celach informacyjnych oraz w celu zapewnienia dostępu technicznego. cTrader Store nie jest brokerem i nie zapewnia doradztwa inwestycyjnego, nie udziela spersonalizowanych rekomendacji ani nie gwarantuje przyszłych wyników.

Możesz także polubić

Wskaźnik
AI
SMC
+4
Weekly Daily Opening Gaps — NWOG & NDOG Indicator Professional-grade opening gap visualization for institutional traders
Wskaźnik
Volume
Key Levels
View tick activity across a selected chart range with Point of Control, Value Area High and Value Area Low.
Wskaźnik
ATR
BOS
+4
Based on market structure and draws liquidity zones, institutional flows, and consolidation ranges. Smart Money Concepts
Logo „Oscillator Scanner”
Najwyżej oceniane
4.7
(4)
$20
/
$39
Wskaźnik
ATR
RSI
+7
Track the Movement of Market Assets with an Oscillator Scanner in Real-Time!
Wskaźnik
Doji
Volume
+5
Instantly spot high-liquidity institutional moves with clean, non-obtrusive triangle alerts on cTrader charts.
Wskaźnik
ATR
SMC
+2
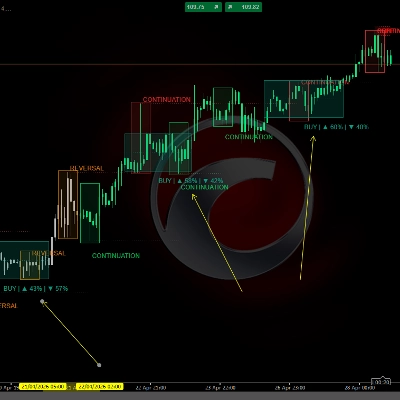
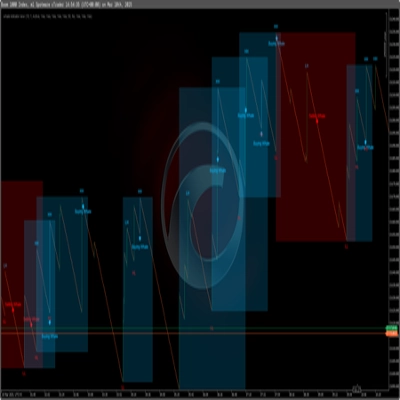
HTF POWER 3 ICT Power of 3 · M1 Precision · H4 Intelligence Auto-detect Accumulation → Manipulation → Distribution
Wskaźnik
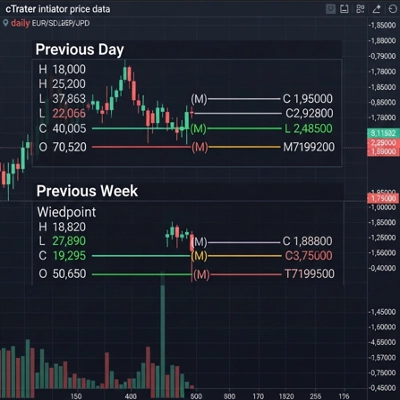
The Weekly Daily Levels indicator shows the OHLC, and mid-point prices for the previous day and week.
Wskaźnik
AI
Forex
+5
Whale Hunting Indicator
Wskaźnik
ATR
RSI
+6
Market structural patterns , specifically the concepts of Change of Character (ChoCH) 🔄 and Break of Structure (BoS) 💥
Wskaźnik
ATR
MSS
+5
Advanced market structure and institutional cycle mapper with visual reference cards and entry alerts
Wskaźnik
Forex
Crypto
+3
Perfect Trend
Wskaźnik
ATR
Wedge
+2
Strong Supertrend Turn Market Movement into a Clear Map Market analysis
Wskaźnik
MACD
Prop
+8
NTNPICLL is a tool to check the best trading hours for the assets and also includes the highest and lowest point
Wskaźnik
ADX
ATR
+2
GOLD SENTINEL v1.0 - A CANDLE-COLORING INDICATOR FOR GOLD.
Logo „supertrend”
Popularne
4.3
(3)
$20
Wskaźnik
ATR
Prop
+4
Supertrend Indicator
Wskaźnik
SMC
Forex
+7
Simple Smart Money Concepts (SMC)
Wskaźnik
BB Breakout Oscillator with alerts! Spot trend reversals using Bollinger Bands. Bullish/Bearish crossovers Alerts.
Wskaźnik
Forex
BTCUSD
+11
Next-gen Volume Oscillator using Hyperbolic Tangent math. No repainting. Includes arrows, alerts, and overlay mode 🎯

Cena

Od 29/06/2025
2
Sprzedaż
13
Bezpłatne instalacje