

present
Daftar dan dapatkan potongan bernilai $50 untuk pembelian pertama anda
Trading product for Volume Spike Candle Tracker Indikator Double Top Fair Value Gap, image 1
Volume Spike Candle Tracker
Indikator
Versi 1.0, Oct 2026
Windows, Mac
Trading product for Volume Spike Candle Tracker Indikator Double Top Fair Value Gap, image 2
Trading product for Volume Spike Candle Tracker Indikator Double Top Fair Value Gap, image 3
Trading product for Volume Spike Candle Tracker Indikator Double Top Fair Value Gap, image 4
Sejak 04/06/2025

Penerangan

Product Overview
The Volume Spike Candle Tracker is a professional-grade cTrader indicator designed to detect institutional 'Smart Money' activity, high-liquidity breakouts, and market exhaustion points. By evaluating real-time Tick Volume against a customizable Moving Average, this tool isolates market noise and visually highlights exactly where the heavy buying or selling pressure enters the market.

Key Features & Visual Signals

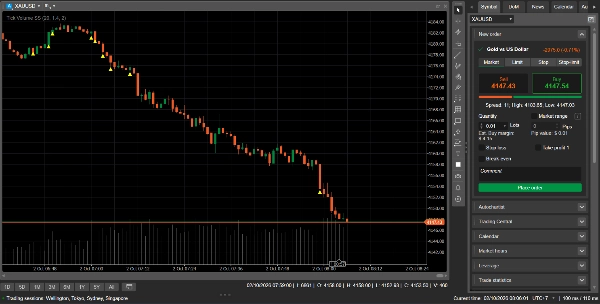
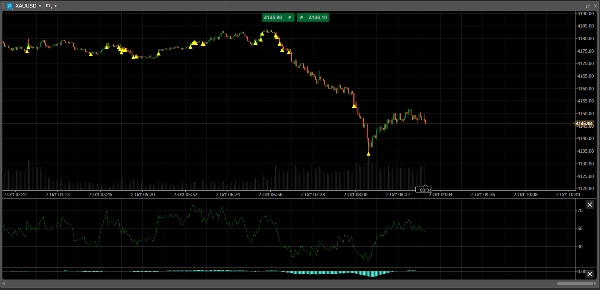
  • Clutter-Free Signals: Instead of changing candle colors or cluttering the lower window, it plots a sharp, perfectly centered Yellow Triangle (▲) underneath the candle's wick.
  • Precision Placement: The indicator automatically offsets the signal below the candle's low price, ensuring your price action and candlestick bodies remain 100% visible.

Parameters & Customization

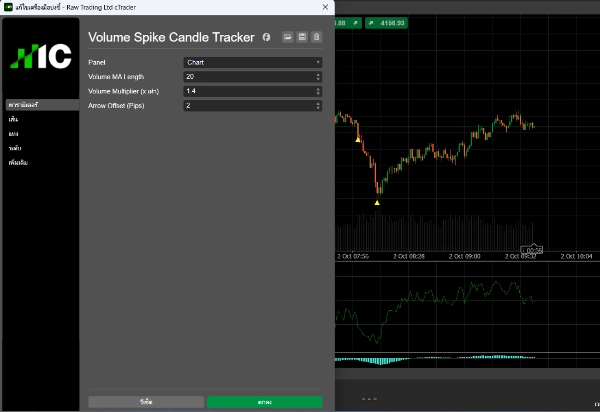
  • Volume MA Length (Default: 20): Adjusts the period used to calculate the average baseline volume.
  • Volume Multiplier (Default: 1.4x): Defines how many times the current volume must exceed the baseline average to trigger the signal.
  • Arrow Offset (Pips) (Default: 2.0): Allows users to fine-tune the vertical gap between the triangle signal and the bottom of the candlestick wick.

Best Use Cases

  • Breakout Confirmation: Validates key support/resistance breaks. A breakout accompanied by a yellow triangle confirms strong institutional backing, reducing the risk of fakeouts.
  • Trend Reversal Warning: Volume surges at the end of extended trends often indicate exhaustion, giving traders early warning signs to lock in profits or prepare for counter-trend setups.

Who is it for?
This tool is perfect for price action traders, breakout traders, and scalpers across all timeframes who want to integrate volume analysis into their strategy without messing up their chart template.

Ringkasan

Ringkasan AI
The Volume Spike Candle Tracker is a cTrader indicator designed to identify institutional trading activity by detecting significant volume spikes relative to a customizable moving average baseline. It analyzes real-time tick volume to filter out market noise and highlights candles with high liquidity using a distinct yellow triangle placed precisely below the candle’s wick, preserving chart clarity and price action visibility. Key adjustable parameters include the volume moving average length, volume multiplier threshold for signal activation, and vertical offset of the triangle indicator. This tool is suited for price action traders, breakout traders, and scalpers across all timeframes. It assists in confirming breakouts with institutional backing and provides early warnings of trend exhaustion, helping traders validate support/resistance breaks and anticipate potential reversals without cluttering their charts.
Profil indikator
Kategori indikator
Volum
Jenis output
Visualisasi
Keperluan data
Data tick
Isyarat yang disokong
Terobosan
Pembalikan
Capahan

Ulasan pelanggan

0.0
Ulasan: 0
Ulasan pelanggan
Belum ada ulasan untuk produk ini. Anda sudah mencuba produk tersebut? Jadilah yang pertama untuk berkongsi pendapat anda!

Perbincangan

Soalan Lazim

Double Top
Fair Value Gap
Volume
Doji
Triangle
Moving Average
Support & Resistance
Produk yang tersedia melalui cTrader Store, termasuk bot dagangan, indikator dan plugin, disediakan oleh pembangun pihak ketiga dan diberikan akses untuk tujuan maklumat dan teknikal sahaja. cTrader Store bukan broker dan tidak memberikan nasihat pelaburan, syor peribadi atau sebarang jaminan prestasi masa hadapan.

Anda juga mungkin suka

Indikator
AI
RSI
+18
Session boxes with UTC offset, OR logic, adjustable opacity, and multi-day lookback.
Indikator
ATR
Forex
+3
LevelMaster S/R: Pinpoint key support & resistance zones with precision. Perfect for traders of all levels Trade smarter
Indikator
AI
ATR
+27
Supertrend Indicator
Indikator
Advanced price action tool that combines multiple technical analysis concepts
Indikator
ATR
MACD
+15
Professional trading indicator: 5 cloud types, 9 ML engines, SMC Order Blocks, Pandas-TA & live dashboard.
Indikator
RSI
Forex
+6
What Constance Brown did with the RSI was to input a momentum calculation within the RSI itself. This the Composite RSI.
Indikator
Forex
BTCUSD
+11
Auto-detects Bullish/Bearish Engulfing patterns to spot trend reversals. Real-time alerts, custom colors, all symbols.
Indikator
A compact, visual multi-timeframe trend indicator for cTrader. Easily spot bullish or bearish trends across 4 customizab
Indikator
Prop
Forex
+11
Customize your Moving Average! Choose any timeframe and price source for precision and flexibility in your analysis.
Logo "supertrend"
Popular
4.3
(3)
Indikator
ATR
Prop
+4
Supertrend Indicator
Indikator
ADX
ATR
+1
Indicador de Sinais Visuais para Spotcrude (WTI) ou SpotBrent com filtros de tendência, operacional de 10 e 15 minutos.
Indikator
Boost your trading with Candlestick Patterns for cTrader – auto-detect key signals for smarter, faster decisions!
Logo "Zigzag Trend"
Dinilai teratas
4.5
(4)
Indikator
AI
ATR
+23
The ZigZag Trend is a market structure tool that filters out small price fluctuations and highlights major swing.
Indikator
Pin Bar
Inside Bar
+2
Advanced candlestick pattern recognition with structural quality scoring, alerts and adaptive chart visuals.
Indikator
Imbalance
Inside Bar
+3
A clean and powerful Smart Money Concepts tool combining Fair Value Gaps, Previous Daily High/Low, Inside/Outside bar
Indikator
AI
ATR
+20
Algorithmic trend precision for cTrader.
Indikator
Prop
Forex
+13
VIX Pro: Volatility Index Tool with ATR-Based Breakout Alerts
Indikator
RSI
RSI on the main chart with 45/55 momentum levels, overbought/oversold levels, averaged RSI, and multi-timeframe support.

Harga

Sejak 04/06/2025

















