

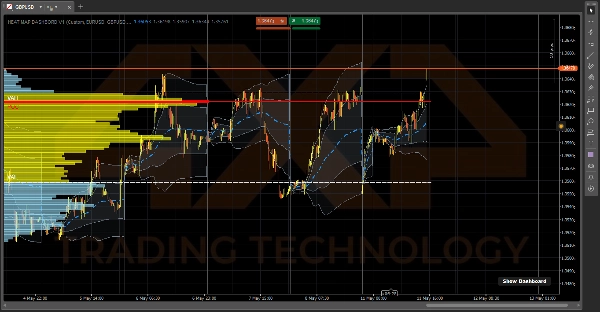

คำอธิบาย
⚠️อัปเดตข้อมูลเชิงลึกที่แท้จริง⚠️
🔥 แดชบอร์ดแผนที่ความร้อน 📈
เทอร์มินัลโฟลว์คำสั่งและโมเมนตัมระดับสถาบันสำหรับ cTrader.
แดชบอร์ดแผนที่ความร้อน ไม่ใช่แค่การซ้อนกราฟพื้นฐาน—มันคือระบบนิเวศการซื้อขายสามส่วนที่สร้างขึ้นโดยตรงในแพลตฟอร์มของคุณ มันให้คุณมองเห็น "X-Ray" ในสภาพคล่องของตลาด ค่าเฉลี่ยถ่วงน้ำหนักตามปริมาณที่แท้จริง และแนวโน้มระดับมหภาค ทั้งหมดนี้โดยไม่ทำให้คอมพิวเตอร์ของคุณช้าลง ⚡
🎯 สิ่งที่มันทำ (มุมมองของเทรดเดอร์)
ระบบจะแบ่งการซื้อขายของคุณออกเป็นสามขั้นตอนง่ายๆ:
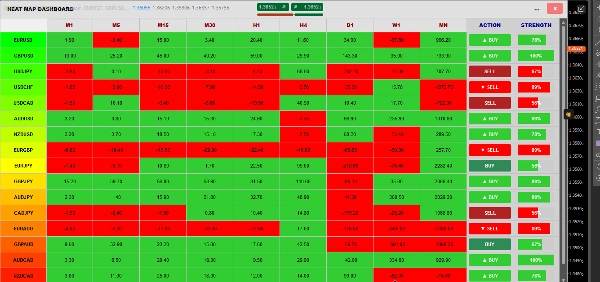
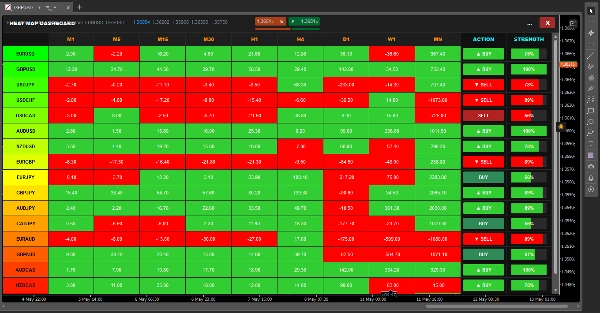
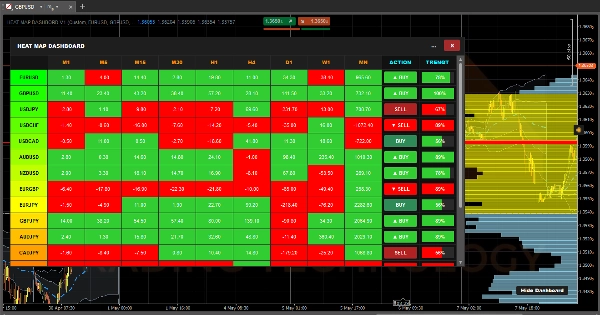
- 🎛️ ขั้นตอนที่ 1: สิ่งที่ควรเทรด (เมทริกซ์) แทนที่จะคลิกผ่านกราฟหลายสิบกราฟ แดชบอร์ดจะสแกน 17 สินทรัพย์ต่างๆ ใน 9 ช่วงเวลา (M1 ถึงรายเดือน) มันคำนวณโมเมนตัมสำหรับแต่ละเซลล์และระบายสีตามนั้น เพียงแค่ดูครั้งเดียว คุณก็รู้ได้ทันทีว่าคู่ไหนอยู่ในแนวโน้มขนาดใหญ่และพร้อมสำหรับการเทรด
- 🌊 ขั้นตอนที่ 2: ใครเป็นผู้ควบคุม (VWAP) เมื่อคุณเลือกคู่แล้ว ให้ดูที่ Daily Anchored VWAP มันแสดงราคากลางที่แท้จริงโดยอิงจาก ปริมาณ ไม่ใช่แค่แท่งเทียน เมฆส่วนเบี่ยงเบนมาตรฐานที่แรเงาทำหน้าที่เป็นแนวรับ/แนวต้านแบบไดนามิก แสดงให้คุณเห็นอย่างชัดเจนว่าเมื่อใดที่ตลาดถูกซื้อเกินหรือขายเกินอย่างหนัก
- 📊 ขั้นตอนที่ 3: ที่ไหนควรเข้า (VRVP) สุดท้าย Visible Range Volume Profile แสดงตำแหน่งที่สภาพคล่องสถาบันหนักอยู่ มันจะวาดเส้น Point of Control (POC) และเส้น 70% Value Area (VAH & VAL) ให้โดยอัตโนมัติ ซึ่งช่วยให้คุณได้ระดับที่แม่นยำสำหรับการเข้าและออกคำสั่ง
⚙️ วิธีการทำงาน (เบื้องหลัง)
ตัวชี้วัดส่วนใหญ่ที่พยายามคำนวณคณิตศาสตร์มากขนาดนี้จะทำให้แพลตฟอร์มของคุณค้างทันทีและทำให้ cTrader ใช้ CPU ถึง 100% เพื่อป้องกันสิ่งนั้น แดชบอร์ดแผนที่ความร้อน ใช้เครื่องยนต์อิสระสามตัวที่ได้รับการปรับแต่งอย่างสูงทำงานพร้อมกัน:
1. เครื่องยนต์แดชบอร์ด (ชีพจร 2 วินาที) ⏱️ หากเราคำนวณ 153 ชุดผสม (17 คู่ x 9 ช่วงเวลา) ในทุกๆ การเปลี่ยนแปลงราคา คอมพิวเตอร์ของคุณจะร้อนจนละลาย แต่เครื่องยนต์นี้ทำงานบน ตัวจับเวลาชีพจร 2 วินาที ทุก 2 วินาที มันจะเงียบๆ ดูราคาจาก 14 แท่งเทียนก่อนหน้า เปรียบเทียบกับราคาปัจจุบัน และระบายสีเซลล์เป็นสีเขียว (โมเมนตัมบวก) หรือสีแดง (โมเมนตัมลบ)
2. เครื่องยนต์ VRVP (ตัวอ่านหน้าจอ) 🖥️ แทนที่จะโหลดข้อมูลแท่งเทียนประวัติศาสตร์นับพัน แผนผังปริมาณทำหน้าที่เป็น "ผู้ฟังมุมมอง" แบบไดนามิก มันจะทำงานเฉพาะเมื่อคุณซูมหรือเลื่อนกราฟจริงๆ มันถาม cTrader ว่าแท่งเทียนใดที่มองเห็นบนหน้าจอของคุณ คำนวณปริมาณทับซ้อนที่แม่นยำสำหรับแท่งเหล่านั้น และวาดพื้นที่ค่า 70% ใหม่ทันที
3. เครื่องยนต์ VWAP (ตัวสะสมทิก) 🧮 VWAP เป็นสิ่งเดียวที่คำนวณจากทิกสด อย่างไรก็ตาม เพื่อให้รวดเร็วมาก มันใช้ "ชุดข้อมูลสะสม" ที่น้ำหนักเบา แทนที่จะคำนวณใหม่ทั้งวันทุกวินาที มันเพียงแค่เพิ่มปริมาณทิกใหม่ลงในยอดรวมพื้นหลังที่กำลังวิ่ง และล้างข้อมูลโดยอัตโนมัติในวินาทีที่นาฬิกาตีเที่ยงคืน
4. ตัวจัดการหน้าต่าง (ผู้เปลี่ยนรูปร่าง) 🪟 แดชบอร์ดถูกห่อหุ้มด้วยตรรกะการปรับขนาด C# แบบกำหนดเองที่ฟังการทำงานของจอมอนิเตอร์ของคุณ เมื่อคุณกดปุ่ม ขยายเต็มจอ [ ] หรือ คืนค่า [=] ตัวชี้วัดจะอ่าน Chart.Width และ Chart.Height แบบเรียลไทม์ ปรับรูปร่างทันทีให้พอดีกับหน้าจอของคุณโดยไม่ยุบ!
สรุป
1. Market Momentum Matrix: Scans 17 assets across 9 timeframes (from 1 minute to monthly), calculating and color-coding momentum to identify trending pairs quickly.
2. Daily Anchored Volume Weighted Average Price (VWAP): Displays true average prices weighted by volume, with dynamic standard deviation clouds indicating overbought or oversold conditions.
3. Visible Range Volume Profile (VRVP): Maps institutional liquidity by highlighting the Point of Control (POC) and 70% Value Area (VAH & VAL) within the visible chart range, aiding precise entry and exit levels.
The dashboard operates via four optimized engines: a 2-second heartbeat engine for momentum updates, a viewport-driven VRVP engine for volume profile recalculations, a tick-accumulating VWAP engine for real-time volume-weighted pricing, and a dynamic window manager that adjusts the interface to fit the chart size. This architecture ensures efficient performance and real-time responsiveness. The indicator supports visualization, signals (including trend strength, breakouts, and reversals), and filtering based on tick data, volume, and market structure analysis. It is tagged for aggressive trading, market structure, liquidity sweeps, support/resistance, and risk dashboard functionalities.
รีวิวจากลูกค้า
5 | 67 % | |
4 | 33 % | |
3 | 0 % | |
2 | 0 % | |
1 | 0 % |
การสนทนา
คำถามที่พบบ่อย


























ราคา