

present
Registrieren Sie sich und erhalten Sie $50 Rabatt auf Ihren ersten Kauf
Trading product for FULL-MARKET-VIEW-DASHBOARD Indikator EMA Bollinger Bands, image 1
FULL-MARKET-VIEW-DASHBOARD
Indikator
1 käufe
Version 1.1, Apr 2026
Windows, Mac
5.0
Bewertungen: 2
Trading product for FULL-MARKET-VIEW-DASHBOARD Indikator EMA Bollinger Bands, image 2
Trading product for FULL-MARKET-VIEW-DASHBOARD Indikator EMA Bollinger Bands, image 3
Trading product for FULL-MARKET-VIEW-DASHBOARD Indikator EMA Bollinger Bands, image 4
Trading product for FULL-MARKET-VIEW-DASHBOARD Indikator EMA Bollinger Bands, image 5
Trading product for FULL-MARKET-VIEW-DASHBOARD Indikator EMA Bollinger Bands, image 6
Trading product for FULL-MARKET-VIEW-DASHBOARD Indikator EMA Bollinger Bands, image 7
Trading product for FULL-MARKET-VIEW-DASHBOARD Indikator EMA Bollinger Bands, image 8
Trading product for FULL-MARKET-VIEW-DASHBOARD Indikator EMA Bollinger Bands, image 9
Trading product for FULL-MARKET-VIEW-DASHBOARD Indikator EMA Bollinger Bands, image 10
Seit 27/02/2026
33.16K
Gehandeltes Volumen
25.96K
Pip-Gewinn
10
Verkäufe
490
Kostenlose Installationen

Beschreibung

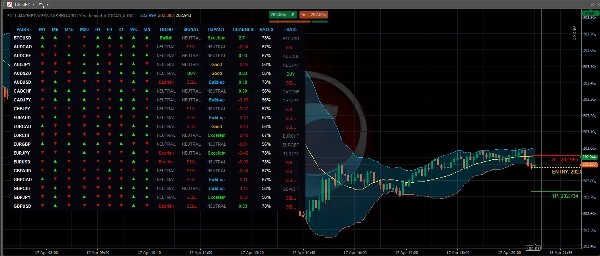
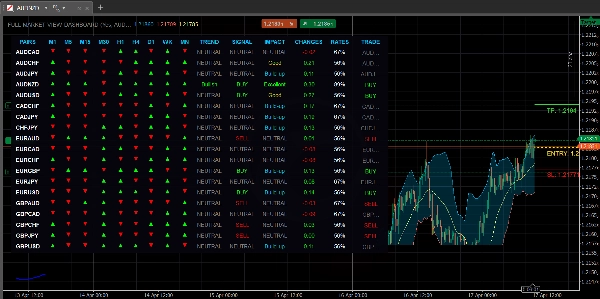
💎 FULL-MARKET-VIEW DASHBOARD: Premium Edition 📈

Der ultimative Multi-Timeframe-Scanner & automatisierte Risikomanager für cTrader.

🛑 Hören Sie auf zu raten und beginnen Sie mit algorithmischer Präzision zu handeln. Das Premium Full-Market-View Dashboard ist eine komplette Trading-Suite, die Ihnen einen „Vogelperspektive“ 🦅 auf bis zu 28 Währungspaare bietet, unterstützt von einem fortschrittlichen State-Machine Risk Manager 🧠, der Ihre Einstiege, Stop-Losses und mehrstufigen Take-Profits vollständig automatisch verwaltet. 👐✨

🚀 Was ist neu im Premium-Update?

1. Die „Ghost-Line“ Multi-Target State Machine 👻🎯 Der Risikomanager wurde komplett überarbeitet. Er zeichnet nicht mehr nur statische Linien – er hat Gedächtnis.

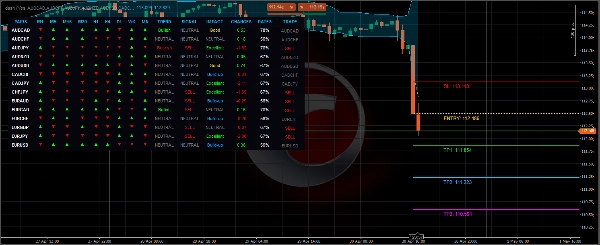
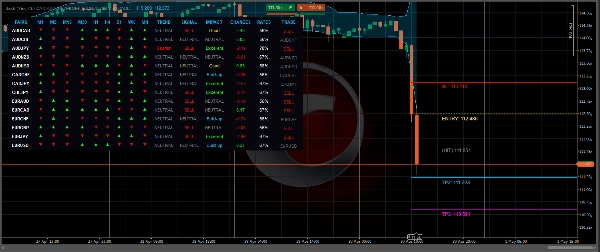
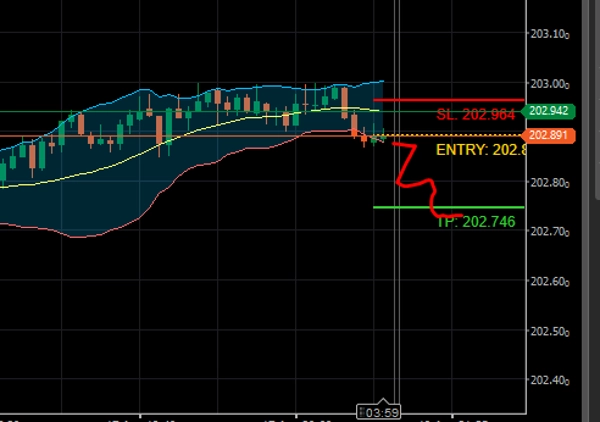
  • Multi-TP Skalierung ⚖️: Der Algorithmus berechnet und sichert TP1, TP2 und TP3 basierend auf präzisen ATR (Average True Range) Volatilitätsmessungen. 📏
  • Visuelles Archivieren 🗂️✅: Wenn der Markt Ihren Take Profit erreicht, verschwindet die solide Ziellinie nicht einfach. Sie verwandelt sich sofort in eine gepunktete „Ghost“-Linie mit der Beschriftung (HIT) und hinterlässt einen dauerhaften visuellen Nachweis Ihrer erfolgreichen Trades im Chart. 🏆
  • Automatisches Chart-Reinigen 🧹✨: Sobald Ihr Stop Loss getroffen wird oder alle Take Profits erfüllt sind, löscht das System die verbleibenden aktiven Linien und schafft so Platz für das nächste große Setup.

2. Institutionelle „Reversal Override“-Logik 🔄🛡️ Der Markt ändert sich schnell, und Ihr Indikator sollte das auch tun. ⚡ Wenn Sie sich in einem aktiven „BUY“-Setup befinden, der Markt aber plötzlich umschwenkt und ein mathematisch gültiges „SELL“-Signal erzeugt, löst der Algorithmus sofort einen Reversal Override aus. Er löscht das alte, fehlerhafte Setup und zeichnet Ihre neuen Short-Ziele, damit Sie nie auf der falschen Seite des Marktes gefangen sind. 📉🏃‍♂️

3. Absturzsichere Symbolerkennung 🛡️🔌 Broker verwenden unterschiedliche Namen für Paare (z. B. EURUSD.c, EURUSD_raw). Das Premium Dashboard verfügt über ein dynamisches „Sicherheitsnetz“ 🕸️, das den Datenfeed Ihres Brokers scannt. Wenn ein Symbol fehlt oder falsch eingegeben wurde, überspringt das Dashboard es elegant, anstatt abzustürzen, und wechselt automatisch zurück zur Anzeige des Symbols Ihres aktuell aktiven Charts. 🧠✅

📊 Kernfunktionen des Dashboards:

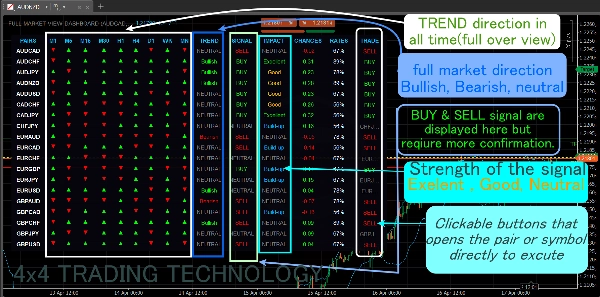
  • Die „Regel der 7“ Multi-Timeframe-Konsens 🎯: Scannt 9 verschiedene Zeitrahmen (M1 bis monatlich) gleichzeitig. Wenn 7 oder mehr Zeitrahmen übereinstimmen, hebt es einen hochwahrscheinlichen bullischen 🟢 oder bärischen 🔴 Makrotrend hervor.
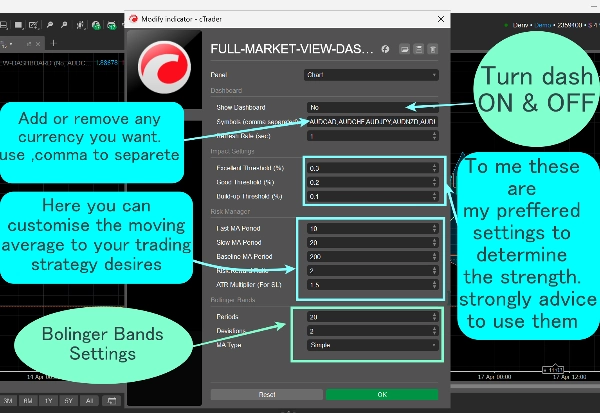
  • 200 EMA Baseline-Filter 🌊🚦: Der integrierte Fast/Slow Moving Average Crossover gibt nur Signale aus, wenn der Preis sicher mit dem makroökonomischen 200 EMA Trend handelt und schützt Sie so vor Fehlsignalen. 🛡️
  • Echtzeit-Momentum-Impact 🏎️💨: Berechnet automatisch tägliche prozentuale Veränderungen und klassifiziert die Marktbewegung als Ausgezeichnet, Gut oder Aufbau, damit Sie genau wissen, wie viel „Gas im Tank“ ist. ⛽
  • Ein-Klick-Chartwechsel 🖱️⚡: Klicken Sie direkt im Dashboard auf ein Währungspaar, um sofort Ihr aktives Chart zu wechseln und direkt ins Geschehen einzusteigen.

⚙️ So funktioniert es in Echtzeit:

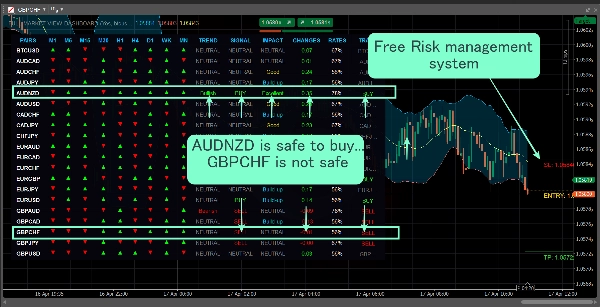
  1. Scan 🔍: Schauen Sie auf das Dashboard, um Paare mit einer Gewinnrate von 80-100 % und einem soliden „bullischen“ oder „bärischen“ Trend zu finden.
  2. Klicken 🎯: Klicken Sie auf die „BUY“- oder „SELL“-Schaltfläche im Dashboard, um sofort dieses Chart zu öffnen.
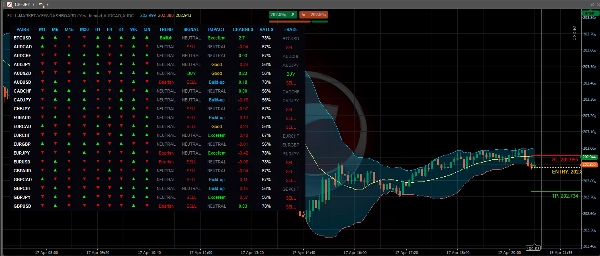
  3. Ausführen 🤖: Warten Sie auf das Kreuzen des Fast/Slow MA. Sobald die Kerze schließt, sichert der Algorithmus Ihren Einstieg, Stop Loss und bis zu drei Take Profits auf dem Bildschirm.
  4. Verwalten 🍿💰: Lehnen Sie sich zurück und beobachten Sie, wie der Markt Ihre Ziele nacheinander trifft, während sie sich in gepunktete (HIT) Linien verwandeln! 🥂💸

Zusammenfassung

KI-Zusammenfassung
The FULL-MARKET-VIEW-DASHBOARD is a professional trading indicator suite designed for the cTrader platform. It provides a comprehensive multi-timeframe scanner that analyzes up to 28 currency pairs simultaneously across nine timeframes (from 1 minute to monthly). The dashboard identifies high-probability bullish or bearish macro trends using a "Rule of 7" consensus and filters signals with a 200 EMA baseline to reduce false entries.

Key features include an advanced State-Machine Risk Manager that automates trade management by setting entries, stop losses, and up to three take profit levels based on ATR volatility. The risk manager visually archives hit targets with dotted "ghost" lines and automatically clears charts after stop loss or full take profit execution. It also incorporates an institutional-grade "Reversal Override" logic to switch trade direction instantly when market conditions change.

The dashboard supports crash-proof symbol detection, adapting to broker-specific pair naming conventions to maintain stability. Real-time momentum impact is calculated to classify market movement strength. Users can switch charts instantly by clicking pairs within the dashboard, streamlining trade execution.

This indicator outputs signals related to crossovers, trend strength, level touches, breakouts, and session open ranges, relying on tick data for real-time analysis. It is categorized under statistics indicators and risk management tools.
Indikatorprofil
Indikatorkategorie
Statistik
Ausgabetyp
Signale
Datenanforderungen
Tick-Daten
Unterstützte Signale
Durchbrechen
Trendstärke
Level – Berührung
Ausbruch
Level – Durchbrechen
Eröffnungsspanne der Sitzung

Kundenbewertungen

5.0
Bewertungen: 2
5
100 %
4
0 %
3
0 %
2
0 %
1
0 %
Kundenbewertungen
April 30, 2026
The first result can be misleading. Tracking 5 to 8 markets first, compare the result with 10 minute review, and only scale if 20 percent less clicking still looks controlled.
April 27, 2026
Would not overtrust it, but No reason to ignore it either. The use case is clear, and it helps if the setup is already disciplined. A clean journal needs both hit rate and average R.

Diskussion

Häufig gestellte Fragen (FAQ)

EMA
Bollinger Bands
Supertrend
Key Levels
Risk Dashboard
ATR
Über den cTrader Store verfügbare Produkte, einschließlich Handelsbots, Indikatoren und Plugins, werden von externen Entwicklern bereitgestellt und nur zu Informations- und technischen Zugriffszwecken verfügbar gemacht. cTrader Store ist kein Broker und erbringt keine Anlageberatung, persönlichen Empfehlungen oder eine Garantie für zukünftige Performance.

Mehr von diesem Autor

Indikator
Crypto
GBPUSD
+7
GUPPY TREND MASTER V3.. Visualize Market Sentiment with the 38-EMA Rainbow The Guppy Trend Master 4X4 Indicator
Indikator
ATR
RSI
+11
This indicator puts three helpful trading tools on your chart at once. Think of it like having three expert traders
Indikator
RSI
AI-assisted
+1
Transform how you view market momentum with the RSI Velocity Gauge Pro. It's FREE FOR ALL
Indikator
Market Structure
Stop guessing which trading session you in, with Sessions indicator sessions are in your finger tips like a pro
Indikator
AI-assisted
Tired of staring at the same old charts? The Theme Customizer indicator brings a whole new level of personalization
Indikator
Aggressive
Supertrend
+5
Stop trading with tunnel vision! 🚫 The Heat Map Dashboard is an institutional-grade visual trading assistant
cBot
ATR
Channel
+5
3 in 1 Earn While Asleep come with 3 intergraded modes, Scalper mode, Day trader mode and Investor mode
1.4
Gewinnfaktor
Desktop-Plugin
Trade Journal
AI Integration
+1
A cTrader plugin displaying monthly/yearly PnL calendar tiles and trading statistics. This is want you need

Das könnte Sie auch noch interessieren

Indikator
ADX
ATR
+5
Range-filter BUY/SELL flips with an ATR or swing stop, three targets, five confluence stars and a live panel
Indikator
Volume
Custom range volume profile between two draggable anchors. Auto source timeframe, Total/Up-Down/Delta, POC, Value Area.
Indikator
EMA
RSI
+4
🚀📈 Plot buy/sell signals on Range Bars using Moving Averages and RSI. Clear, actionable trading insights.🚀📈
Indikator
Imbalance
Inside Bar
+3
A clean and powerful Smart Money Concepts tool combining Fair Value Gaps, Previous Daily High/Low, Inside/Outside bar
Indikator
AI
SMC
+7
The ultimate tool for Price Action and ICT. High, Low and Mid levels for days, weeks Inc. NY Midnight and Custom Range.
Indikator
BOS
Volume
+5
The Volume Delta Indicator using Institutional Level 2 DOM Data, The Edge Institutions Pay Millions For, now on cTrader
Indikator
ATR
EMA
+3
The UTBot you know from TradingView — now on cTrader with confirmed signals, VWAP, EMA and session overlays.
Indikator
RSI
SMC
+17
RSI, MACD, Stochastic, CCI & Momentum divergence scanner with confluence scoring. Never miss a signal again!
Indikator
Ultra-Flexible VWAP Indicator with Advanced Customization
Indikator
ZigZag Smart Alert for cTrader Description: ZigZag Smart Alert is a next-generation swing indicator for cTrader, designe
Indikator
Key Levels
Market Structure
+1
HTF Candle Projector displays the current Higher Timeframe candle (4H or 1H) as a real projected candle LIVE..
Indikator
ATR
Channel
+1
Bollinger Bands Advanced Squeeze & Breakout System, Real-Time On-Chart Dashboard, Auto-Squeeze Detector, Dual-Band Cloud
Indikator
EMA
SMA
+5
Trend Blueprint All-in-One Trend & Structure
Indikator
BOS
Imbalance
+4
Automatically detects and highlights both Bullish and Bearish Fair Value Gaps (FVGs).
Indikator
Volume
Key Levels
+2
Support and resistance from a rolling volume profile, ranked by strength or recency, updated live.
Indikator
Forex
EURUSD
+4
Check the correlations between dozens of assets in one elegant display.
Indikator
Forex
BTCUSD
+10
MultiTimeframe MA
Indikator
Channel
Imbalance
+2
Adaptive volatility channel based on moving average and standard deviation (σ).

Preis

Seit 27/02/2026
33.16K
Gehandeltes Volumen
25.96K
Pip-Gewinn
10
Verkäufe
490
Kostenlose Installationen
























