
Description
🏆 10,000+ Traders Trust Our 25+ Algorithm Suite! 🏆
From Market Structure & Liquidity to Smart Exit Systems & Predictive Tools - we've built EVERY tool you need for consistent.
👉 Access All 25+ PROVEN Systems:
_______________________________________________
📌 Market Structure Indicators
· ✅ AdvancedMarket Structure: Bos, Choch, SwinLevels, Order Blocks, Market Structure& Liquidity Finder
· 🔄 Dynamic Market StructureAnalysis of Turning Points
· 🧱 Order Block
· ⚖️ Market Imbalance
· ⛓️ BOS & CHOCH
· 🧠 ICT Power of 3
_______________________________________________
🔚 Smart Exit Systems
_______________________________________________
📐 ZigZag Indicators
· 🔍 ZigZag Price LiquidityProjection
· ➖ ZigZag
_______________________________________________
🧱 Support & Resistance Indicators
· 🟩 SmartTrend Support &Resistance Lines
· 🧱 All Support and ResistanceLevels
_______________________________________________
📊 Trend & Channel Indicators
· 📊 Supertrend
_______________________________________________
💧 Volume & Liquidity Tools
_______________________________________________
⚡ Momentum & RSI Indicators
· 🔎 Multi-Level Candle Bias
Tracker
_______________________________________________
🔮 Prediction & Projection Tools
· 📐 Prediction Based on Linreg& ATR
· 📏 Fibonacci Linear RegressionMulti-timeframe
· 📈 Volume-Powered Market Flow Projector_________________________
_________________________________________________________________________________________________
_________________________________________________________________________________________________
ZigZag Structure Pro – 🚀
Automatically identifies the market's significant turning points (key highs and lows) and draws dynamic support and resistance zones that update in real-time. 🎯 Unlike traditional static levels, this indicator constantly adapts to the changing price structure.
What is it for? ❓
This indicator is a professional technical analysis tool designed to:
- Identify institutional levels: 🏛️ Automatically detects points where the price has formed important high and low structures.
- Market structure analysis: 📊 Classifies each movement according to the bullish/bearish structure methodology (Higher Highs, Lower Lows, etc.).
- Trend projection: 🔮 Extends trendlines into the future to anticipate potential price reaction zones.
- Trading reversals and continuations: 💰 The marked levels serve as a reference for entries, stop-loss, and profit targets.
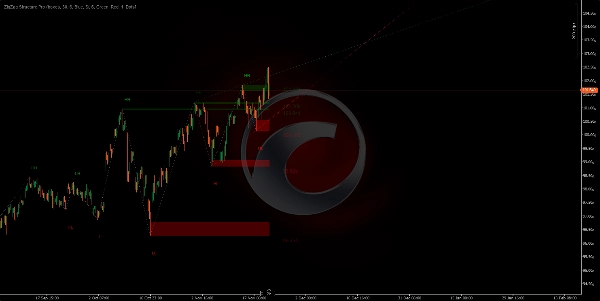
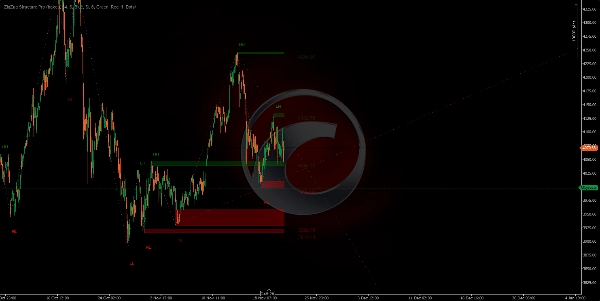
The indicator draws on your chart: ✍️
1. Support/Resistance Zones (Rectangles)
- Green zones: 🟢 Mark support areas (significant lows where the price could bounce).
- Red zones: 🔴 Mark resistance areas (significant highs where the price could pull back).
- These zones are projected forward, showing the current active levels.
- The thickness of each zone represents the candle body where the pivot was formed.
https://chartshots.spotware.com/c/691f5a4d75ac4
https://chartshots.spotware.com/c/691f6b4f2e98b
https://chartshots.spotware.com/c/691f6c6fda808
https://chartshots.spotware.com/c/691f6d0aa6155
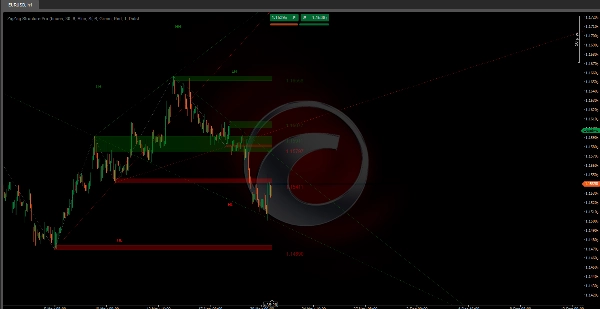
2. Connection Lines ⚡
- Connect each pivot with the next, creating a visual "zigzag" pattern.
- Eliminate market noise, showing only the truly significant movements.
- Make it easy to see the direction and structure of the trend at a glance.
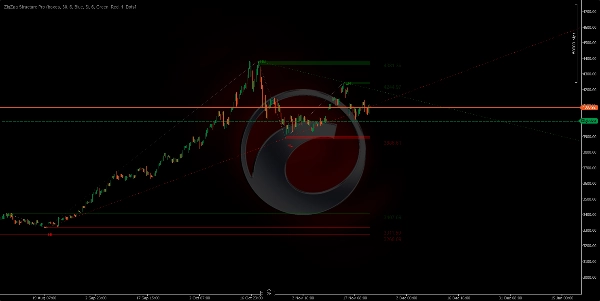
3. Projected Trend Lines (Extended Green/Red)
- Drawn from the previous pivot to the current one and extended into the future.
- Green: 🟢 Bullish trend lines (from lows).
- Red: 🔴 Bearish trend lines (from highs).
- Shows the 2 most recent and active trendlines.
- Useful for detecting trend breakouts or respects.
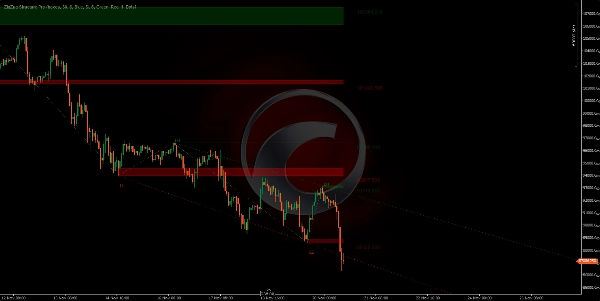
4. Market Structure Labels 🏷️
Each pivot shows a label indicating its classification:
- HH (Higher High): ↗️ Higher High - Bullish continuation.
- LH (Lower High): ⬆️ Lower High - Possible bearish reversal.
- HL (Higher Low): ⬇️ Higher Low - Possible bullish reversal.
- LL (Lower Low): ↘️ Lower Low - Bearish continuation.
Logic behind the algorithm 🧠
The indicator uses an adaptive zigzag algorithm that:
- Scans the price looking for highs and lows within a configurable period (default 34 bars).
- Filters insignificant movements through a minimum deviation threshold (default 6 pips).
- Validates each pivot ensuring it represents a real change in the market structure.
- Compares structures between consecutive pivots to classify the type of movement.
- Dynamically updates the zones as new pivots appear, removing the oldest ones.
Main Settings ⚙️
- Pivot Lookback Bars: Controls the sensitivity of the pivot detector (lower = more pivots, higher = only major pivots).
- Price Deviation Filter: Noise filter - movements smaller than this value are ignored.
- Maximum Visible Zones: Number of historical levels that remain visible (from 1 to 20).
- Zone Display Type: Choose between rectangles (full zones) or simple lines.
- Show Extended Trendlines: Activate/deactivate trend projections.
Quick Parameter Guide 📖
Pivot Lookback Bars (Default: 30)
- ↑ Increase (40-100): FEWER pivots, more important. For swing trading.
- ↓ Decrease (15-25): MORE pivots, more signals. For scalping/day trading.
Price Deviation Filter (Default: 6)
- ↑ Increase (8-15): Filters noise, only large movements. Fewer signals, higher quality.
- ↓ Decrease (2-5): More sensitive, captures small movements. More signals.
Maximum Visible Zones (Default: 6)
- ↑ Increase (10-20): More historical levels visible. For deep analysis.
- ↓ Decrease (2-4): Only recent levels. Clean chart.
Historical Pivot Limit (Default: 200)
- ↑ Increase (300-500): More history for calculations. Long-term analysis.
- ↓ Decrease (50-150): Only recent structure. Better performance.
Active Projections Count (Default: 5)
- ↑ Increase (5-10): More projected trend lines.
- ↓ Decrease (1-2): Only dominant trends. More clarity.
Show Extended Trendlines (Yes/No)
- Enabled: Projects trends into the future.
- Disabled: Only historical zigzag.
🎯 Quick Setups
- Scalping: Lookback 15-20 | Deviation 3-5 | Zones 3-4
- Day Trading: Lookback 25-35 | Deviation 6-8 | Zones 5-6
- Swing Trading: Lookback 40-60 | Deviation 10-15 | Zones 8-12
Summary
Customer reviews
5 | 0 % | |
4 | 100 % | |
3 | 0 % | |
2 | 0 % | |
1 | 0 % |


!["Gaussian Channel [Iridio Capital]" logo](https://cdn.ctrader.com/image/webp/7c039209-5573-4a54-a072-f9528b503103_41960)


