
Description
Pinescriptlabs Store indicators: 🤖Pinescriptlabs Store cBots :
ICT Power of 3 (cBot) Gold & BTC BreakoutSession Pivots(new)YieldShield"
SmartTrend Support &
Resistance Lines
Dynamic Market Structure
Analysis of Turning Points
Fibonacci Linear
Regression Multi-timeframe
Multi-Level Candle Bias
Tracker
Auto Support and
Resistance Trend Lines
All Support and
Resistance Levels
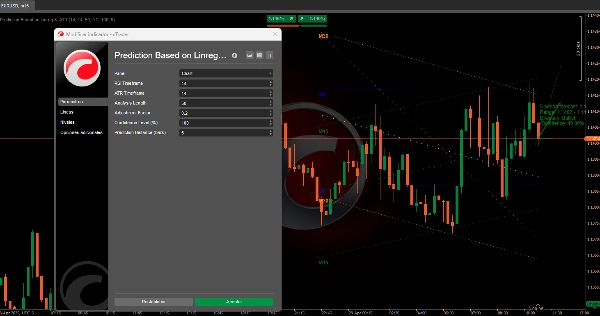
📈 Multi-Timeframe Regression Channel & ATR Prediction Algorithm
This system predicts an asset's potential price movement by combining multi-timeframe trend analysis 📊, market volatility 📉, and technical indicator confirmation ✅. Its goal is to project a future price range with measurable confidence, ideal for identifying high-probability risk-reward opportunities 💰.
🔧 How It Works Step by Step
1️⃣ Multi-Timeframe Trend Analysis
- Regression Channels Across Timeframes:
The algorithm simultaneously analyzes four different timeframes (from short to long-term). For each: - Calculates a statistical trend line based on historical price behavior.
- Defines a prediction channel around this line (using past volatility to set upper/lower bounds).
- Hierarchical Influence:
Shorter timeframes carry more weight in the final direction, reflecting their sensitivity to recent movements.
2️⃣ Volatility Integration (ATR) 🌊
- Dynamic Volatility Adjustment:
Predictions adapt to current market conditions: - High volatility → Wider projections
- Low volatility → Conservative adjustments
- Future Range Scaling:
The prediction band automatically adjusts based on expected volatility.
3️⃣ Trend Confirmation System ✅
Combines four key signals to validate or challenge the regression-based direction:
- Moving Average Crosses (trend confirmation)
- Momentum Oscillators (strength assessment)
- Volatility Indicators (overbought/oversold detection)
- Divergence Analysis (trend reversal clues)
- Output: A scoring system that reinforces or questions the predicted trend.
4️⃣ Confidence Calculation 🎯
- Timeframe Alignment:
Confidence increases when trends agree across timeframes. - User-Defined Threshold:
Traders can set a minimum confidence level to filter only high-certainty signals.
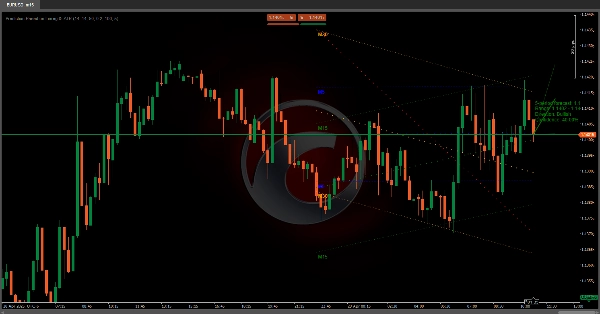
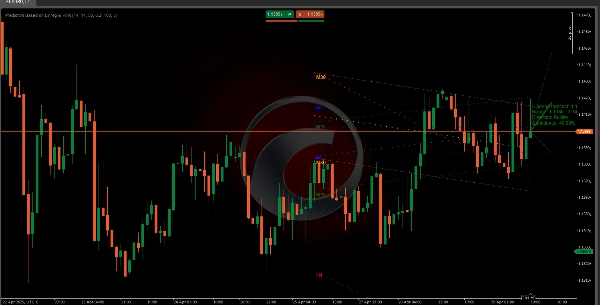
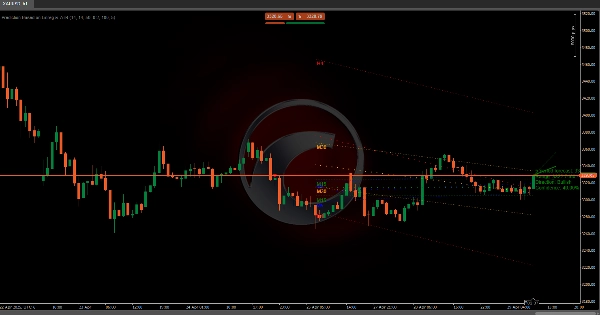
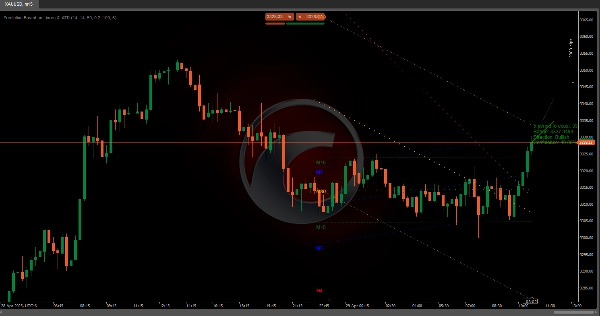
5️⃣ Intuitive Visualization 📉📈
- Prediction Line:
Shows the central expected path (green = bullish 🟢, red = bearish 🔴, gray = neutral ⚪). - Range Bands:
Highlight the most probable price movement zone, adjusted for volatility. - Info Label:
Summarizes projected price, range, direction, and confidence level.
🌟 Key Advantages
- Multi-Dimensional Approach: Combines trend, volatility & momentum to reduce false signals.
- Self-Adjusting: Adapts to choppy or trending markets automatically.
- Transparent Metrics: Quantifiable confidence helps manage expectations.
📌 Practical Example
If the system detects:
- Bullish trend in short timeframes + momentum confirmation
- Low recent volatility
- Strong timeframe agreement
→ Projects a price rise with a tight band and high confidence (e.g., 85%) 🚀
Summary
The ATR component dynamically adjusts the prediction bands to current market conditions, widening during high volatility and narrowing during low volatility periods. A trend confirmation system integrates four key signals—moving average crosses, momentum oscillators, volatility indicators, and divergence analysis—to validate or question the regression-based trend, producing a scoring system that indicates trend strength.
Confidence levels are calculated based on alignment of trends across timeframes, with user-configurable thresholds to filter signals by certainty. Visualization includes a central prediction line (color-coded for bullish, bearish, or neutral trends), range bands highlighting probable price zones, and an info label summarizing projected price, range, direction, and confidence.
The indicator supports markets including cryptocurrencies (e.g., BTCUSD), commodities (e.g., XAUUSD), and others. It aims to identify high-probability risk-reward opportunities by combining trend, volatility, and momentum analysis in a self-adjusting, transparent framework.


!["[Hamster-Coder] Pivot Points (Demo)" logo](https://cdn.ctrader.com/image/webp/87b54299-8c73-4942-9207-4bc6db824811_31153)


