Indicator
RSI
Breakout
XAUUSD
ATR
Commodities
Signal
Supertrend
Crypto
BTCUSD
ZigZag
"ZigZag" logo
4.2
25/07/2025
2880
Desktop
"ZigZag" uploaded image

Pinescriptlabs Store indicators:                        Pinescriptlabs  Store cBots :  (cBot) Gold & BTC BreakoutSession Pivots(new)


Advanced Market Structure: Bos, Choch, SwinLevels, Order Blocks,  Market Structure & Liquidity Finder (New)

ZigZag Price Liquidity Projection

Trailing Smart Algorithm (new)

S&R Structural ZigZag                                

ZigZag

 BOS & CHOCH

Zones Supply Demand

Leverage Liquidation Map

Auto-Trend Channel


Volume POC Heatmap


PREMIUM SSL CHANNEL

Prediction Based on Linreg & ATR

 ICT Power of 3 
                                                   

SmartTrend Support &
Resistance
Lines
       

Fair Value Gap Sessions                


RSI Trend Trigger

Channel Breakout System

Supertrend

Market Imbalance

Adaptive Trend Channel 

Dynamic
Market Structure
Analysis
of
Turning
Points

Order Block

Fibonacci
Linear
Regression
Multi-timeframe

Dynamic RSI

Momentum Fair Value Gap

Market Flow Projection

Dynamic Trend Gradient

Multi-Level
Candle Bias
Tracker

Zig-Zag Extremity Tracker

Reactive Moving Average

Auto
Support and
Resistance
Trend
Lines

All
Support and
Resistance
Levels

Dynamic Range Momentum

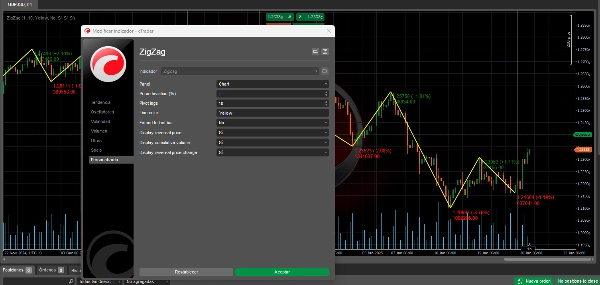
The ZigZag Indicator: Simplifying Market Trends ๐Ÿ“‰๐Ÿ“ˆ

The ZigZag is a technical indicator that helps identify significant trend changes in an asset by filtering out minor market movements. Its primary purpose is to simplify visual price analysis by eliminating the "noise" of small fluctuations.

How It Works โš™๏ธ

  • ๐Ÿ“Š Analyzes prices to find significant turning points (pivots).
  • ๐Ÿ“ˆ A turning point is deemed significant when the price changes by a specific minimum percentage (deviation parameter).
  • ๐Ÿ”— Connects these turning points with straight lines, forming a "zigzag" pattern.
  • ๐Ÿ•’ Updates dynamically as new price data emerges.


Trading Utility ๐Ÿ’ก

Trend Identification ๐Ÿ“

  • ๐Ÿ” Helps visualize the primary market direction.
  • ๐Ÿš€ Makes it easier to spot bullish and bearish trends.
  • ๐Ÿ“ Clearly highlights key support and resistance levels.

Pattern Analysis ๐Ÿ“‹

  • ๐ŸŽฏ Simplifies the identification of chart patterns.
  • ๐Ÿ•ต๏ธโ€โ™‚๏ธ Highlights price formations like triangles, flags, and other patterns.
  • ๐ŸŒŠ Enhances clarity when recognizing Elliott waves.

Trade Management ๐ŸŽ›๏ธ

  • ๐ŸŽฏ Identifies potential entry and exit points.
  • ๐Ÿ›ก๏ธ Helps determine stop-loss levels based on previous pivots.
  • ๐ŸŽฏ Facilitates setting realistic price targets.

Volatility Analysis ๐ŸŒก๏ธ

  • ๐Ÿ“ The distance between pivots reflects market volatility.
  • ๐Ÿงฉ Helps adjust strategies according to the size of movements.
  • โณ Distinguishes between consolidation periods and directional trends.

Signal Confirmation โœ…

  • ๐Ÿ” Serves as a confirmation tool for other indicators.
  • ๐Ÿšช Validates breakouts of key levels.
  • ๐Ÿ”— Can be combined with other indicators for more robust strategies.


Key Considerations ๐Ÿง 

Itโ€™s Retrospective ๐Ÿ“…

  • โช Pivot points are only confirmed after the movement occurs.
  • ๐Ÿ”ฎ Itโ€™s not predictive on its own.
  • โš–๏ธ Should be used in combination with other indicators for decision-making.

Parameter Adjustments ๐Ÿ”ง

  • ๐ŸŽš๏ธ Sensitivity depends on the deviation percentage set.
  • ๐Ÿ” A smaller percentage shows more pivot points.
  • ๐Ÿงน A higher percentage filters out minor moves, showing only significant changes.

Timeframe Usage ๐Ÿ•’

  • ๐Ÿ•ฐ๏ธ Works on any timeframe.
  • ๐Ÿ”„ Parameters should be adjusted based on trading horizons.
  • ๐ŸŒ Analyzing across multiple timeframes offers a more comprehensive view.

๐Ÿ“ˆ Use the ZigZag indicator as a powerful tool to simplify analysis, identify trends, and improve decision-making in your trading journey! ๐Ÿš€


4.2
Reviews: 5
5
40 %
4
40 %
3
20 %
2
0 %
1
0 %
Customer reviews
October 23, 2025
good
July 9, 2025
Pros: Simple and flexible settings, clear swing visualization, stable performance on major assets. Cons: No alerts or Fibonacci tools, lacks swing statistics, requires additional confirmation for trading decisions.
June 11, 2025
Wow
May 19, 2025
This just takes emotion away from trading. its great good work pal. i would also like to buy the source code from you.
May 2, 2025
can I buy the source code from you please?
More from this author
Indicator
RSI
Breakout
XAUUSD
+5
Auto-Trend Channel
Adaptive trend channel using linear regression and Pearson correlation for dynamic support, resistance, and trends.
Indicator
RSI
Breakout
XAUUSD
+6
Order Block
Identify bullish and bearish Order Blocks to spot key support/resistance levels and potential trend reversals! ๐Ÿ“ˆ๐Ÿ”„
Indicator
RSI
Breakout
XAUUSD
+5
Zones Supply Demand
๐Ÿ“ŠZones Supply & Demand: Identifies key price levels with high volume concentration, marking Supply/Demand Zones & Marke
Indicator
RSI
XAUUSD
Breakout
+5
BOS & CHOCH
Market structural patterns , specifically the concepts of Change of Character (ChoCH) ๐Ÿ”„ and Break of Structure (BoS) ๐Ÿ’ฅ
Indicator
RSI
Breakout
XAUUSD
+6
Volume POC Heatmap
๐Ÿ“Š Shows volume by price levels, highlights POC, and key zones. Identifies dynamic support/resistance and imbalances.
Indicator
RSI
Breakout
Supertrend
All Support and Resistance Levels
"Identify key market zones and visualize support/resistance from multiple timeframes on a single chart.
Indicator
RSI
Breakout
XAUUSD
+6
Fair Value Gap Sessions
identify and highlight temporary market inefficiencies known as "fair value gaps" ๐Ÿšจ within specific trading Sessions.
Indicator
RSI
Breakout
XAUUSD
+5
Supertrend
๐Ÿ’น Define a price channel ๐Ÿ“ˆ and determine trend direction (bullish ๐ŸŸข or bearish ๐Ÿ”ด).
Indicator
Indices
RSI
XAUUSD
+7
RSI Divergence
Detects bullish and bearish divergences
Indicator
RSI
Breakout
XAUUSD
+4
Dynamic Market Structure Analysis of Turning Points
Identify market structure effortlessly with swing highs, lows, CHoCH, and BOS levels for smart trading decisions! ๐Ÿ“Š๐Ÿ”"
Indicator
RSI
Breakout
XAUUSD
+4
Multi-Level Candle Bias Tracker
Price direction by calculating the probability of reaching new highs/lows. Shows levels & stats๐Ÿ“ˆ
Indicator
RSI
Breakout
Supertrend
Trend Heikin Multi MA
๐Ÿš€ TrendHeikinMultiMA: Advanced trend detection using Heikin-Ashi smoothing & MAs! Eliminates noise, confirms real trend
Indicator
RSI
Breakout
Supertrend
Market Trend OB
Price action to detect when the market changes trend (MSB) and defines, order blocks , ZigZag etc.๐Ÿ“Š
Indicator
RSI
Breakout
Supertrend
Leverage Liquidation Map
๐Ÿ“Š Liquidation Map: Potential areas where highly leveraged investors might face liquidations.
Indicator
RSI
Breakout
Supertrend
Swing Levels
๐Ÿ” Automatically detect support and resistance levels based on "swings" or pivots
Advanced Market Structure Bos,Choch,SwinLevels, Order Blog
Advanced price action toolย that combines multiple technical analysis concepts
Indicator
RSI
XAUUSD
Breakout
+4
ICT Power of 3
๐ŸŽฏ Auto-plots key zones (Accumulation, Manipulation, Distribution) . Reveals institutional traps & trends.
Indicator
RSI
Breakout
Supertrend
Zig-Zag Extremity Tracker
Dynamically adjusts regression channels based on ZigZag extremes, resetting when price breaks bands to track real trends
You may also like
Indicator
Indices
Breakout
Supertrend
[CB] Pivot Points Pro
You can use the cTrader Pivot Points Pro indicator to find a good pullback entry in a trend
Indicator
NAS100
Indices
NZDUSD
+9
MultiTimeFrame MovingAverage MTF MA
MultiTimeframe MA
Indicator
RSI
Breakout
XAUUSD
+6
Volume POC Heatmap
๐Ÿ“Š Shows volume by price levels, highlights POC, and key zones. Identifies dynamic support/resistance and imbalances.
Indicator
Grid
NAS100
XAUUSD
+6
AutoFibRetracement
A powerful overlay tool designed to automatically plot Fibonacci retracement levels based on a custom window.
Indicator
Indices
AI
Machine Learning Momentum Index
Theย Machine Learning Momentum Index (MLMI)ย represents the next step in oscillator trading.
Laguerre RSI
Laguerre RSI is based on John EHLERS' Laguerre Filter to avoid the noise of RSI.
AlphaTrend Pro by LudwigICT
[Hamster-Coder] Pivot Points (Demo)
[Hamster-Coder] Pivot Points (Demo)
DMI 3 bar v2
Shows BUY & SELL signals for 3 & 4 BAR PATTERN (Morning star/ Evening star). It is adjustable and it will SHOW ARROWS.
E7 Volume Profile
E7 Volume Profile, more modern look and feel.
SupertrendChannels
Supertrend-based channel for entries, trailing stops, and dynamic support/resistance zones.
E7 Correlation Dashboard
E7 Correlation Dashboard.
Indicator
Indices
ADXMultiframeIndicator
Multi-Timeframe ADX Trend Dots & Arrows
Indicator
Indices
Prop
Forex
+1
Vision - Advanced Session Indicator
Indicator
Indices
Commodities
CCI - With Arrows and 40 80 EMA Logic_noSourceCode
The Advanced CCI & EMA Indicator combines the CCI with 40 & 80 EMA logic to generate precise arrows signaling direction
Indicator
RSI
Breakout
Supertrend
+1
Reactive Moving Average
Combines SMA with dynamic correlation to adapt to market trends. Adjusts sensitivity, filters noise๐Ÿš€๐Ÿ“‰
Indicator
RSI
Indices
Signal
QQE-MTF
Multi-timeframe version of the Quantitative Qualitative Estimation (QQE) indicator.
Time To Break Even Indicator v2
Time To Break Even Indicator. This indicator helps you time your trade's entry.