
S&R Structural ZigZag
Indicator
612 downloads
Version 1.0, Jun 2025
Windows, Mac
5.0
Reviews: 1
Description
Pinescriptlabs Store indicators: 🤖Pinescriptlabs Store cBots : (cBot)
PRICE ACTION (New)
Gold & BTC BreakoutSession Pivots(new)
SmartTrend Support &
Resistance
Lines
Dynamic
Market Structure
Analysis
of
Turning Points
Fibonacci
Linear
Regression
Multi-timeframe
Auto
Support and
Resistance
Trend
Lines
All
Support and
Resistance
Levels
Zig Zag Support & Resistance with Swings
1. What Does This Indicator Do? ❓
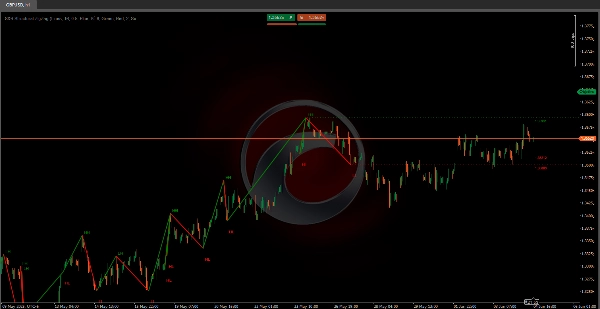
🔍 Detects Price Swings (Highs & Lows)
- Scans recent bars ("Analysis Depth") to find the highest/lowest price in that range.
- Validates swings with a % threshold (e.g., 1%+ change vs. last swing) → Marks new ✅ Swing Highs/Lows.
- Reduces noise ⚡: Only confirms swings if half the analysis period passes without a higher high/lower low.
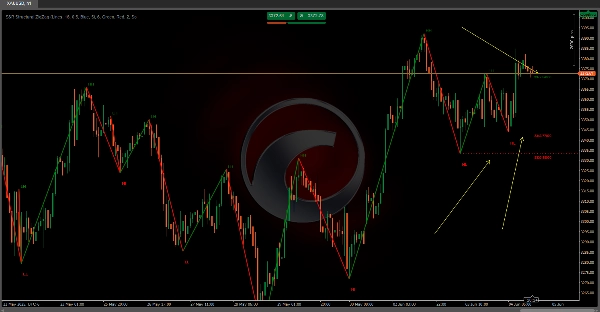
📉 Draws Zigzag Trendlines
- Connects swings with dynamic lines:
- 🟢 Green = Uptrend (new swing > prior).
- 🔴 Red = Downtrend (new swing < prior).
⏹️ Highlights Key Levels
- Support/Resistance Lines: Drawn at each swing’s exact price, extended rightward
- Labels show price values 📌 (e.g., "1.1050") for instant analysis.
🚦 Reveals Market Structure
- Identifies trends at a glance:
- Bullish = Higher Highs (HH) + Higher Lows (HL).
- Bearish = Lower Highs (LH) + Lower Lows (LL).
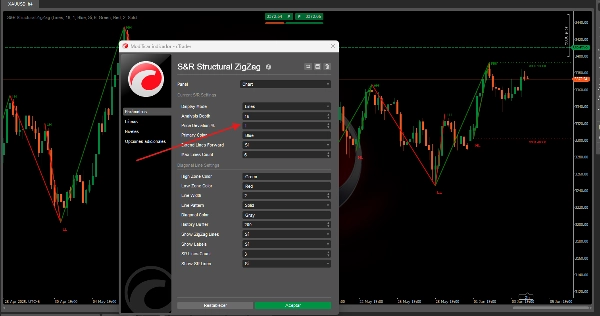
2. How to Use It (Setup Guide) ⚙️
Install on cTrader: Drag & drop onto your chart!
Key Settings:
- Analysis Depth 🔎:
10(default) → Higher values filter noise; lower values catch more swings. - Price Deviation % 📏:
1.0%(adjustable) → Min. price change to validate swings. - Swing Labels 🏷️ (HH/HL/LH/LL): Toggle On/Off.
- Extend Lines ➡️: Project S/R levels infinitely or limit to current bars.
Summary
AI summary
S&R Structural ZigZag is a technical indicator for cTrader that detects price swings by scanning recent bars to identify the highest and lowest prices within a specified analysis depth. It validates swings using an adjustable percentage threshold to mark significant swing highs and lows, reducing noise by confirming swings only if half the analysis period passes without a higher high or lower low. The indicator draws zigzag trendlines connecting these swings, using green lines to indicate uptrends (new swing higher than prior) and red lines for downtrends (new swing lower than prior). It highlights key support and resistance levels by drawing lines at each swing’s exact price and extending them rightward, with labels showing price values for quick reference. The tool also reveals market structure by identifying bullish trends (higher highs and higher lows) and bearish trends (lower highs and lower lows) at a glance. Key customizable settings include analysis depth, price deviation percentage, swing label toggling, and line extension options. Installation is straightforward via drag-and-drop onto charts in cTrader. This indicator supports analysis of various markets including cryptocurrencies (e.g., BTCUSD), commodities (e.g., XAUUSD), and others tagged for breakout and trend strategies.
Indicator profile
Customer reviews
5.0
Reviews: 1
5 | 100 % | |
4 | 0 % | |
3 | 0 % | |
2 | 0 % | |
1 | 0 % |
Customer reviews
August 18, 2025
Clear structural support/resistance mapping, customizable, lightweight. Cons: No auto-labels, no historical level tracking, no alerts.
Discussion
FAQ
BTCUSD
Breakout
Supertrend
Commodities
RSI
Crypto
XAUUSD
Products available through cTrader Store, including trading bots, indicators and plugins, are provided by third-party developers and made available for informational and technical access purposes only. cTrader Store is not a broker and does not provide investment advice, personal recommendations or any guarantee of future performance.


!["High-Low Divergence [Iridio Capital]" logo](https://cdn.ctrader.com/image/webp/443c4661-7abb-40f1-842f-4b6ec560649b_40914)


Price
Since 03/10/2024
163
Sales
39.09K
Free installs