
Descrizione
🚀 Sistema di Rottura del Canale
Questo algoritmo specializzato è progettato per confermare con precisione i punti di ingresso e uscita 🎯 combinando più elementi di analisi tecnica per fornire segnali affidabili.
🔍 Come Funziona?
📊 Canale Basato sulla Volatilità (ATR)
✅ La volatilità del mercato viene calcolata utilizzando l'ATR (Average True Range) 📉.
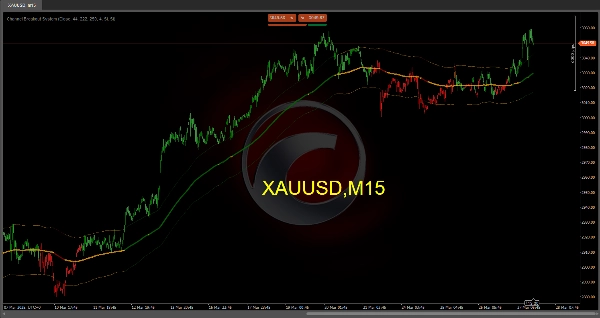
✅ La "Trend MA" viene regolata aggiungendo e sottraendo un valore proporzionale a questa volatilità, formando due linee tratteggiate che fungono da "soffitto" e "pavimento" del mercato.
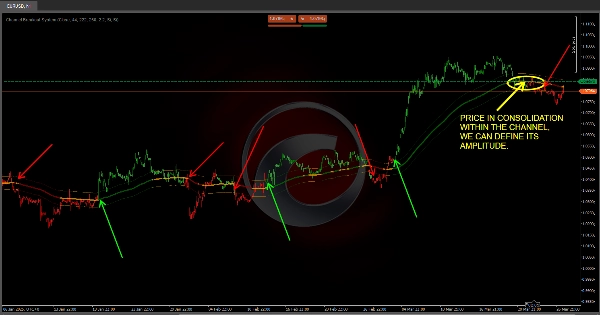
✅ Cosa significa questo per te? Se il prezzo rimane all'interno del canale, il mercato potrebbe essere in fase di range o consolidamento; se rompe chiaramente, è un segnale di un forte movimento di tendenza 📈📉.
✅ Completamente personalizzabile! Regola le impostazioni del canale per adattarle alla tua strategia 📌.
🟢 Rilevamento della Tendenza con Colori Intelligenti
🔹 L'indicatore confronta la posizione della MA veloce con la MA media, e entrambe in relazione alla Trend MA.
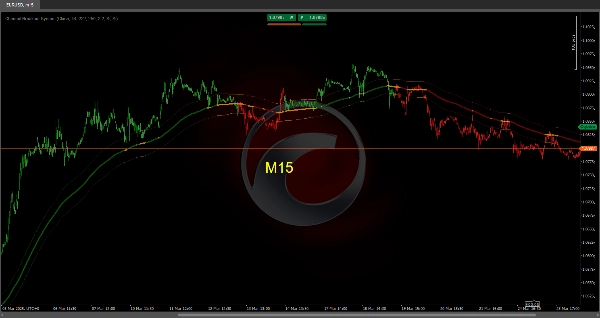
🔹 In base alla fase di mercato, le candele cambiano colore:
- 🟢 Verde → Fase di mercato rialzista.
- 🔴 Rosso → Fase di mercato ribassista.
- 🟠 Arancione o neutro → Possibile consolidamento o incertezza.
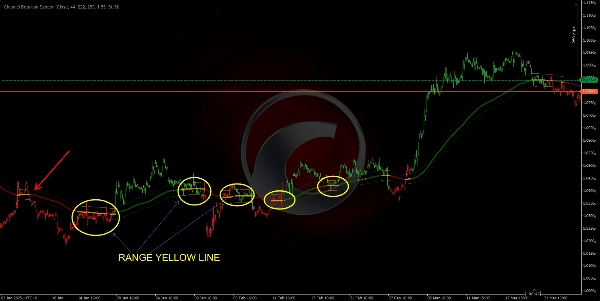
🔹 Se il prezzo e le medie mobili sono "bloccati" all'interno del canale, segnala una fase di consolidamento, aiutandoti a evitare di operare in zone indecise.
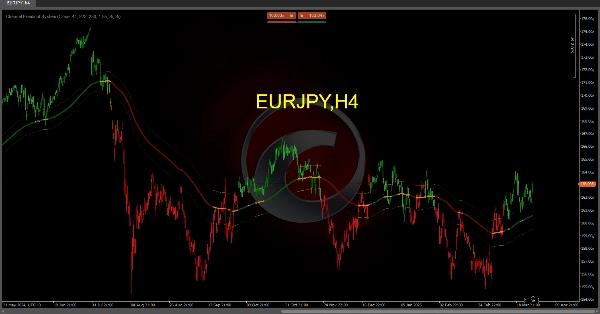
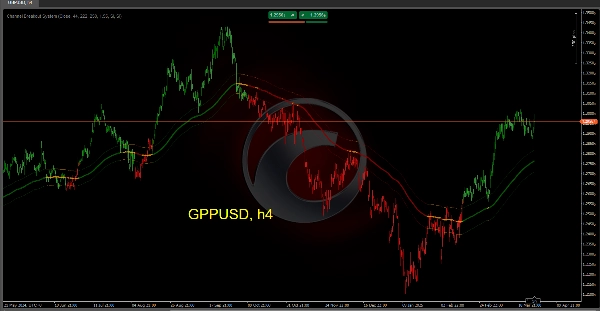
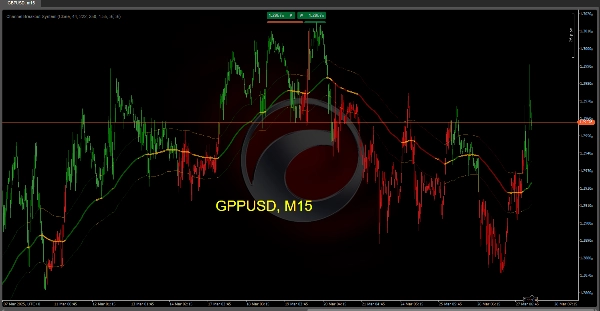
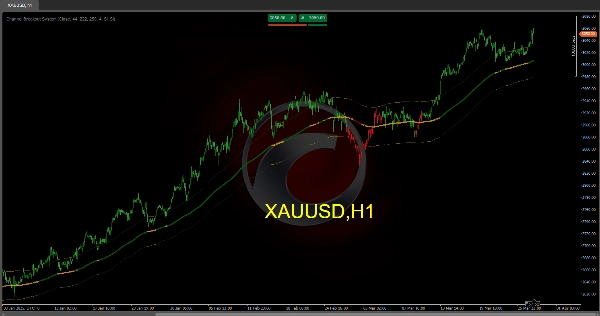
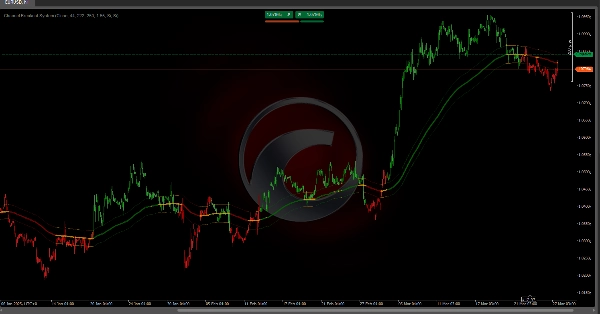
🎯 Come Appare sul Grafico
🔵 Linea di tendenza principale: Cambia colore a seconda della direzione del mercato (verde, rosso o arancione).
📏 Canale tratteggiato: Riflette il range di mercato basato sulla volatilità.
📊 Barre colorate: Forniscono una rappresentazione visiva semplice della fase di mercato attuale.
🚀 Perché Usare Questo Sistema?
✔ Identifica rapidamente se il mercato è in trend o in range.
✔ Evidenzia visivamente la forza e la direzione della tendenza.
✔ Anticipa potenziali inversioni con segnali chiari di breakout e crossover.
✔ Conferma i punti di ingresso e uscita, riducendo i falsi segnali e migliorando la precisione delle operazioni.
🔹 Ottimizza il tuo trading e opera con maggiore fiducia utilizzando Channel Breakout System 🏆. Preparati a individuare le migliori opportunità di mercato! 📈🔥
Indicatori del Ctrader Store:
Dynamic Market Structure
Analysis of Turning Points
Fibonacci Linear
Regression Multi-timeframe
Multi-Level Candle Bias
Tracker
Auto Support and
Resistance Trend Lines
All Support and
Resistance Levels
Riepilogo
Recensioni dei clienti
5 | 33 % | |
4 | 67 % | |
3 | 0 % | |
2 | 0 % | |
1 | 0 % |


![Logo di "[Stellar Strategies] MARSI Signal Plotter"](https://cdn.ctrader.com/image/webp/7b2b8da6-8f8e-4646-8d4a-4710c516c01e_25567)


