
Simple ICT Concepts
Indicator
3 purchases
Version 1.0, Dec 2025
Windows, Mac
4.0
Reviews: 1
Description
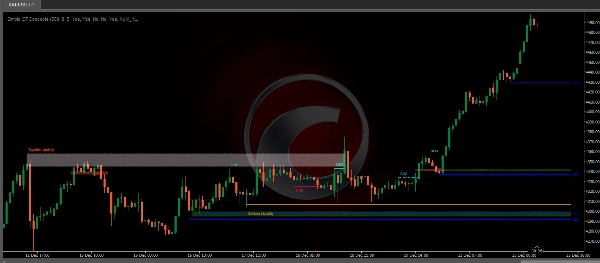
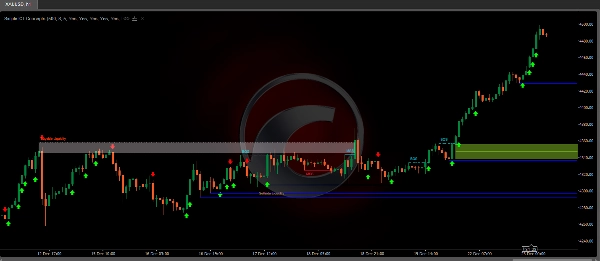
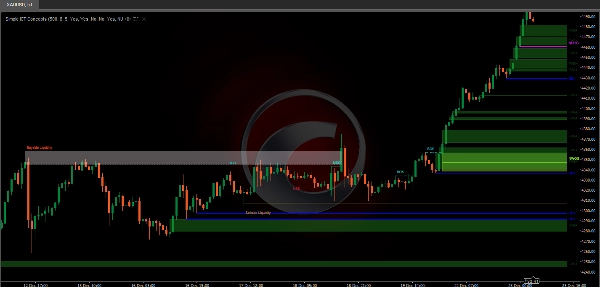
The Simple ICT Concepts Indicator is a powerful tool designed to help traders apply the principles of the Inner Circle Trader (ICT) methodology. This indicator focuses on identifying key zones such as liquidity levels, support and resistance, and market structure, making it an invaluable asset for price action and smart money concept traders.
Key Features
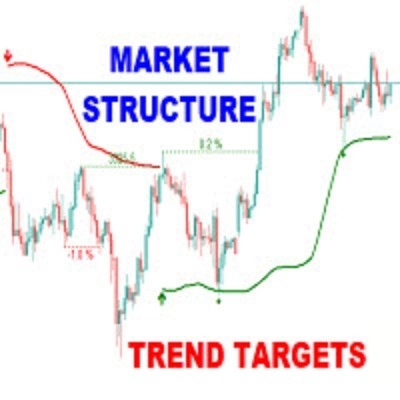
Market Structure:
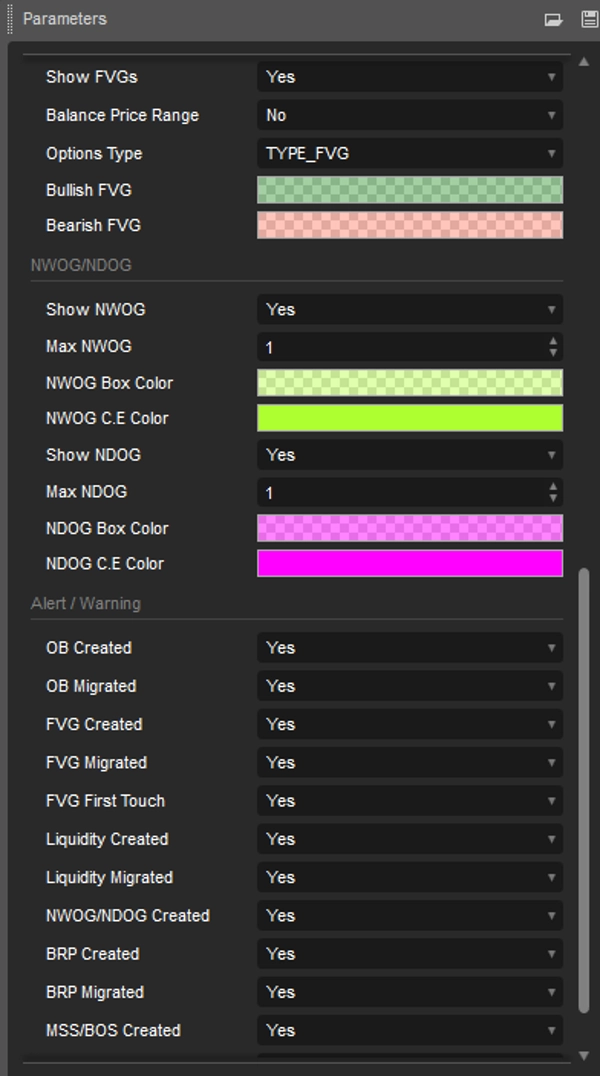
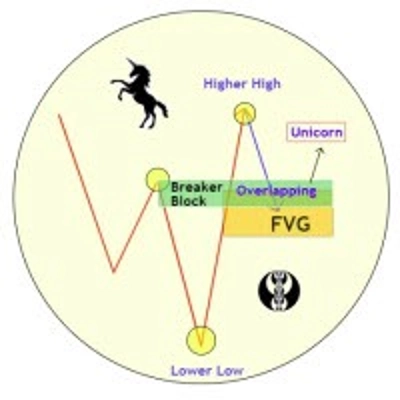
Market structure labels are constructed from price breaking a prior swing point. This allows a user to determine the current market trend based on the price action.There are two types of Market Structure labels included:Market Structure Shift (MSS)Break Of Structure (BOS)A MSS occurs when price breaks a swing low in an uptrend or a swing high in a downtrend, highlighting a potential reversal.This is often labeled as "CHoCH", but ICT specifies it as MSS. On the other hand, BOS labels occur when price breaks a swing high in an uptrend or a swing low in a downtrend.The occurrence of these particular swing points is caused by retracements (inducements) that highlights liquidity hunting in lower timeframes.Key swing points: Higher Highs (HH) and Lower Lows (LL), Higher Lows (HL) and Lower Highs (LH)Displacement:Displacements are scenarios where price forms successive candles of the same sentiment (bullish/bearish) with large bodies and short shadows.These can more technically be identified by positive auto correlation (a close to open change is more likely to be followed by a change of the same sign) as well as volatility clustering (large changes are followed by large changes).Displacements can be the cause for the formation of imbalances as well as market structure, these can be caused by the full execution of a meta order.Volume Imbalance:A Volume Imbalance (V.I.) occurs when there is an area of price that has been left without a candle body. There is up-and-down movement in the overlapping of the wicks, however since the bulk of the volume is in the body of the candle, we dub this a Volume Imbalance.Order Blocks:An ICT (Inner Circle Trader) order block is a price area on a chart where large institutional investors place significant buy or sell orders. Order blocks are a key concept in trading, as they can help traders identify potential support and resistance levels, and anticipate price reversals.Liquidity:Buy-side/Sell-side liquidity levels highlight price levels where market participants might place limit/stop orders.Buyside liquidity levels will regroup the stop-loss orders of short traders as well as limit orders of long traders, while Sell-side liquidity levels will regroup the stop-loss orders of long traders as well as limit orders of short traders.These levels can play different roles. More informed market participants might view these levels as source of liquidity, and once liquidity over a specific level is reduced it will be found in another area.FVG/IFVG:Fair Value Gaps: A three candle formation where the candle shadows adjacent to the central candle do not overlap, this highlights a gap area.Implied Fair Value Gaps: Unlike the fair value gap the implied fair value gap has candle shadows adjacent to the central candle overlapping. The gap area is constructed from the average between the respective shadow and the nearest extremity of their candle body.Balanced Price Range: Balanced price ranges occur when a fair value gap overlaps a previous fair value gap, with the overlapping area resulting in the imbalance area.NWOG/NDOG:This indicator reveals the new week opening gaps (NWOG) and new day opening gaps (NDOG). The NWOG is the gap between Friday's closing price and Sunday's opening price. The NDOG is the gap between the opening price and closing price of the previous day.
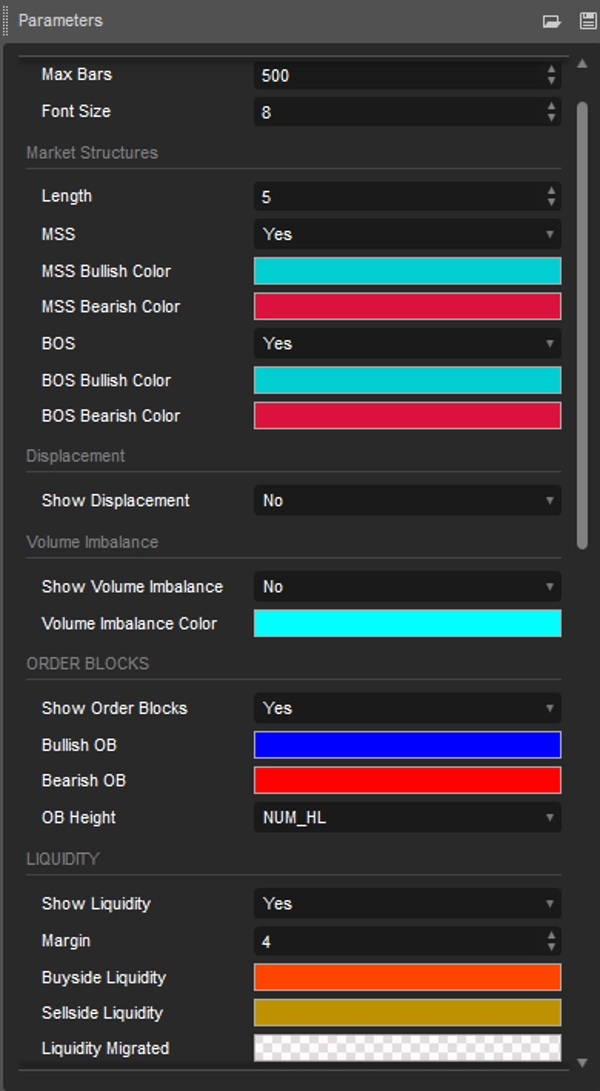
Customizable Features
Users can adjust settings like data length, colors, and display styles to match their trading preferences.
Benefits for Traders
Saves time on manual analysis, enhancing trading efficiency.
Helps make quick and informed decisions during volatile market conditions.
Easy to use for both beginners and experienced traders.
Conclusion
The Simple ICT Concepts Indicator is not just a tool but a comprehensive solution for traders looking to effectively implement ICT strategies. It’s a robust choice for enhancing market analysis and executing precise trades.
Summary
Indicator profile
Customer reviews
4.0
Reviews: 1
5 | 0 % | |
4 | 100 % | |
3 | 0 % | |
2 | 0 % | |
1 | 0 % |
Customer reviews
December 27, 2025
The signal still needs a chart check, no surprise there. One green trade proves nothing.
Discussion
FAQ
BTCUSD
Forex
Signal
Fair Value Gap
Crypto
XAUUSD
NAS100
Products available through cTrader Store, including trading bots, indicators and plugins, are provided by third-party developers and made available for informational and technical access purposes only. cTrader Store is not a broker and does not provide investment advice, personal recommendations or any guarantee of future performance.


Price
36
Sales
2.24K
Free installs