
MACD Indicator NDH
Gösterge
547 i̇ndirmeler
Sürüm 1.0, Dec 2025
Windows, Mac
5.0
Değerlendirmeler: 3
Açıklama
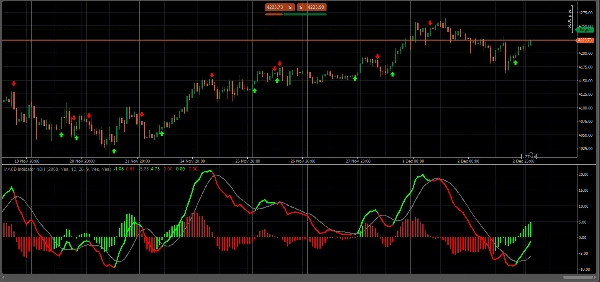
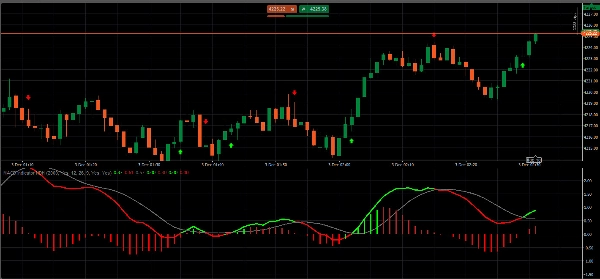
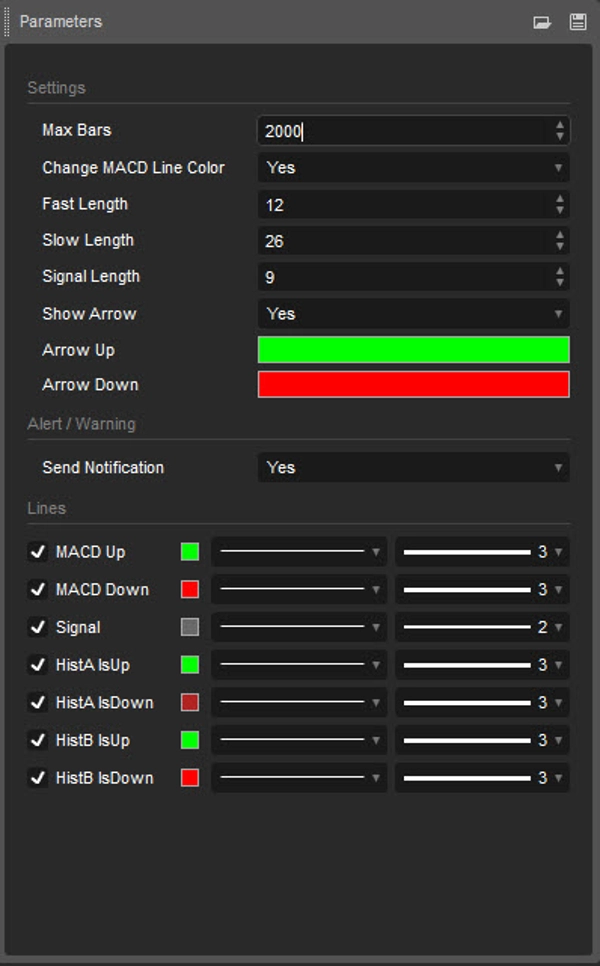
MACD Göstergesi
MACD hattı, Sinyal hattı ve Histogram içerir.
Histogram, hareket yönünü mümkün olduğunca basit göstermek için Sıfır Çizgisinin Üstü ve Altına göre 4 renge sahiptir.
MACD ve Sinyal Hattını Gösterme, Sinyal Hattının kesişimine göre MACD Hattının renginde değişiklik gösterme olanağı sağlar.
MacD ve Sinyal Hattının kesişiminde Noktaları Gösterme, Histogramı açıp kapatma.
Ticaret deneyiminizin tadını çıkarın ve yorumlarınızı ve değerlendirmelerinizi paylaşmaktan çekinmeyin.
Özet
YZ özeti
The MACD Indicator NDH is a technical analysis tool featuring the MACD line, Signal line, and a multi-colored Histogram. The Histogram uses four distinct colors to represent directional movement above and below the zero line, simplifying trend visualization. Users can customize the display to show or hide the MACD and Signal lines, enable color changes on the MACD line based on its crossing with the Signal line, and toggle dots at these crossover points. The Histogram can also be turned on or off according to user preference. This indicator supports markets including Forex, Crypto (e.g., BTCUSD), and commodities such as XAUUSD, as well as indices like NAS100. It is designed to assist traders in identifying momentum and potential trade signals through clear visual cues.
Gösterge profili
Müşteri değerlendirmeleri
5.0
Değerlendirmeler: 3
5 | 100 % | |
4 | 0 % | |
3 | 0 % | |
2 | 0 % | |
1 | 0 % |
Müşteri değerlendirmeleri
April 28, 2026
After using MACD on my previous 2 platforms, finding this one on ctrader was very good. I'd like to edit the colour of the macd to suit my trading technique (when it moves up and down instead of when crossing the signal line), but it's still a very good indicator from this developer.
December 10, 2025
MACD NDH delivers a clean, modern take on the classic MACD. Smooth histogram, customizable EMAs, and clear momentum shifts make it great for intraday and swing use. Lightweight and stable. Alerts and divergence detection would make it even more powerful.
Tartışma
SSS
BTCUSD
Forex
Signal
Crypto
XAUUSD
NAS100
MACD
cTrader Store üzerinden erişilebilen işlem botları, göstergeler ve eklentiler gibi ürünler, üçüncü taraf sağlayıcılar tarafından sağlanır ve yalnızca bilgilendirme ve teknik erişim amaçlarıyla sunulur. cTrader Store bir broker değildir ve yatırım tavsiyesi, kişisel öneriler vermez veya gelecekteki performansı garanti etmez.


Fiyat
38
Satışlar
2.38K
Ücretsiz yüklemeler