
Açıklama
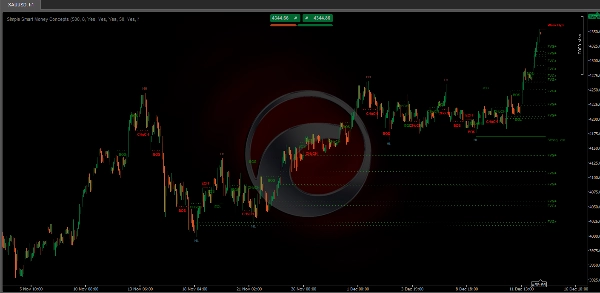
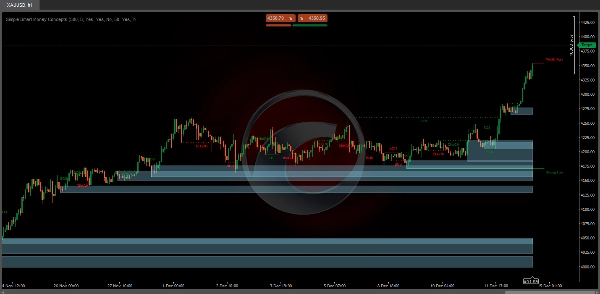
Bu Simple Smart Money Concepts göstergesi gerçek zamanlı piyasa yapısını (iç ve salınım BOS / CHoCH), emir bloklarını, prim ve indirim bölgelerini, eşit yüksek ve düşükleri ve çok daha fazlasını gösterir... böylece tüccarların grafiklerini yaygın olarak kullanılan fiyat hareketi metodolojileriyle otomatik olarak işaretlemelerine olanak tanır.
"Smart Money Concepts" (SMC), likiditeyi daha doğru bir şekilde yönlendirmek ve piyasadaki daha optimal ilgi noktalarını bulmak isteyen fiyat hareketi tüccarları arasında kullanılan bir terimdir. Kurumsal piyasa katılımcılarının nerede emir verdiğini belirlemeye çalışmak, fiyat hareketine dayalı daha pratik giriş ve çıkışlar bulmak için çok makul bir yaklaşım olabilir.
Ana Özellikler
- Gerçek zamanlı iç ve salınım piyasa yapısı:
-
- İç Yapılar: Bu öğeler, daha küçük bir kapsamda veya belirli bir işlem seansında meydana gelen fiyat oluşumları ve desenlerine atıfta bulunur. Paket, küçük destek/direnç seviyeleri veya kısa vadeli trend dönüşleri gibi karmaşık detayları algılayabilir.
- Dış Yapılar: Bunlar, birden fazla seans veya zaman dilimini kapsayan daha büyük, daha önemli piyasa desenleri ve trendlerini içerir. Bu yetenek, tüccarların genel piyasa yönlerini anlamalarına yardımcı olur.
- HH/LH/LL/LH Alanları:
-
- Yüksek Yüksekler (HH), Düşük Yüksekler (LH), Düşük Düşükler (LL) ve Düşük Yüksekleri (LH) tanımlamak, trendi ve piyasa yapısını anlamaya yardımcı olur ve tahmine dayalı analizde destek sağlar.
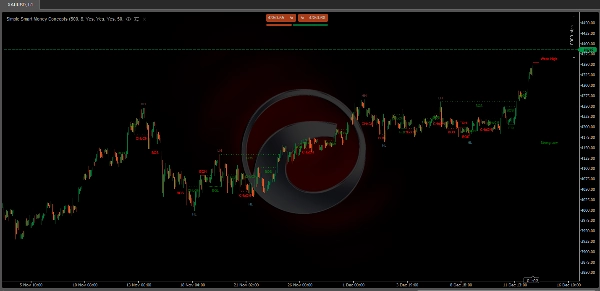
- Yapı Kırılması (BOS):
-
- Bu özellik, fiyatın önemli bir yapıyı kırdığı noktaları belirler, bu da potansiyel olarak yeni bir trend veya trend dönüşünü gösterebilir.
- Karakter Değişimi (CHoCH):
-
- Piyasanın davranışındaki ince değişiklikleri tespit eder, bu da daha geniş piyasa tarafından fark edilmeden önce bir trend değişikliğinin erken aşamalarını gösterebilir.
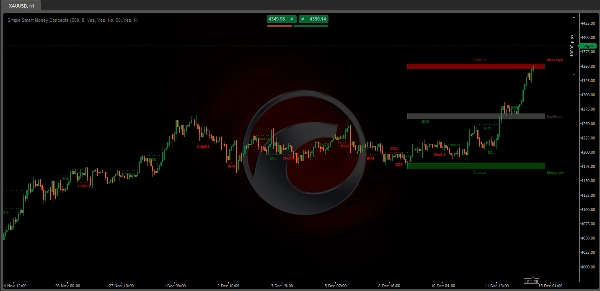
- Emir Blokları:
-
- Bunlar esasen daha önce önemli işlem aktivitelerinin gerçekleştiği fiyat seviyeleri veya bölgeleridir ve muhtemelen akıllı paranın pozisyonlarını işaret eder.
- Eşit Yüksekler ve Düşükler
-
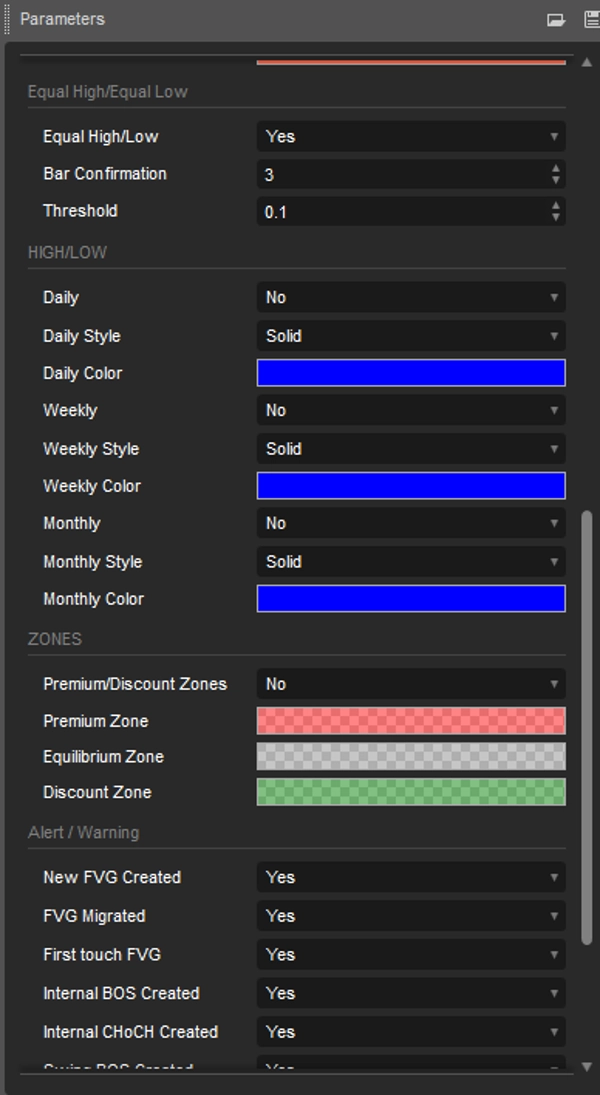
- Eşit yüksek ve düşükleri tespit etmek için grafikte EQH/EQL etiketlerini gösterir.
- Adil Değer Boşlukları:
-
- Adil Değer Boşlukları: Orta mumun yanındaki mum gölgelerinin örtüşmediği üç mumluk bir oluşumdur, bu boşluk alanını vurgular.
- Önceki Yüksekler ve Düşükler:
-
- Kullanıcının günlük, haftalık ve aylık zaman dilimlerinden önceki yüksek ve düşükleri önemli seviyeler olarak görüntülemesine olanak tanır
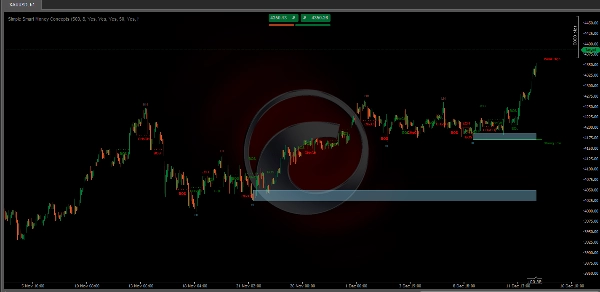
- Prim ve İndirim Bölgeleri aralığı olarak:
-
- Kullanıcının grafikte Prim, İndirim ve Denge bölgelerini görüntülemesine olanak tanır
Özelleştirilebilir Özellikler
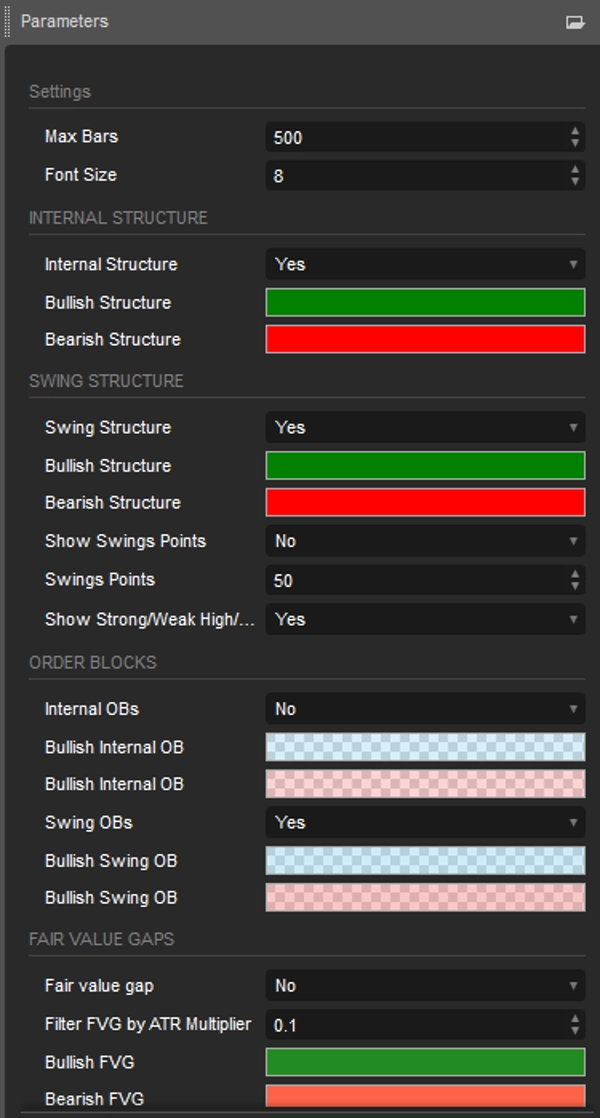
- Kullanıcılar, veri uzunluğu, renkler ve görüntüleme stilleri gibi ayarları işlem tercihleriyle uyumlu olacak şekilde ayarlayabilir.
Tüccarlar için Faydalar
- Manuel analizde zaman kazandırır, işlem verimliliğini artırır.
- Dalgalı piyasa koşullarında hızlı ve bilinçli kararlar alınmasına yardımcı olur.
- Hem yeni başlayanlar hem de deneyimli tüccarlar için kullanımı kolaydır.
Sonuç
Bu Simple Smart Money Concepts Göstergesi sadece bir araç değil, ICT stratejilerini etkili bir şekilde uygulamak isteyen tüccarlar için kapsamlı bir çözümdür. Piyasa analizini geliştirmek ve hassas işlemler gerçekleştirmek için sağlam bir tercihtir.
Özet
Additional features include the identification of equal highs and lows, fair value gaps (three-candle formations indicating price gaps), and previous highs and lows across daily, weekly, and monthly timeframes. It also displays premium, discount, and equilibrium zones to help traders assess value areas.
Users can customize settings such as data length, colors, and display styles to fit their trading preferences. The indicator supports analysis across multiple markets including Forex, cryptocurrencies (e.g., BTCUSD), stocks, and commodities (e.g., XAUUSD).
Designed to streamline chart analysis, the Simple Smart Money Concepts indicator aids traders in making informed decisions by visually representing widely used price action methodologies and institutional order flow concepts.
Müşteri değerlendirmeleri
5 | 33 % | |
4 | 67 % | |
3 | 0 % | |
2 | 0 % | |
1 | 0 % |


