
설명
JMA-Like – 적응형 제로 지연 이동 평균
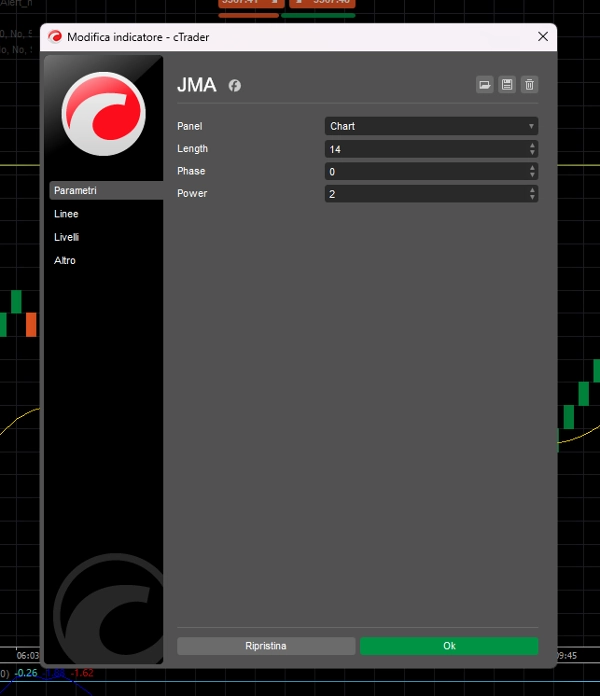
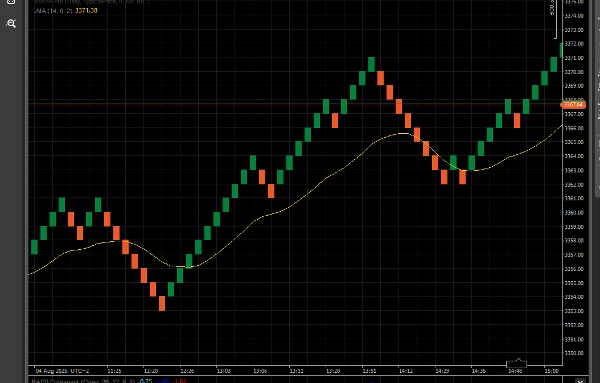
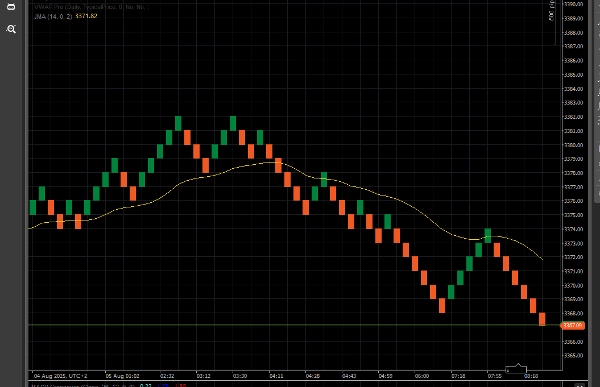
JMA Advanced는 원래 Jurik 이동 평균(JMA)의 동작을 복제하도록 설계된 매우 반응성이 뛰어나고 초부드러운 이동 평균입니다. 시장 변동성에 동적으로 적응하여 지연을 줄이고 노이즈를 필터링합니다.
고급 평활 알고리즘으로 구축된 JMA Advanced는 추세 추종 및 역행 전략 모두에 적합합니다. 반응성과 오버슈트를 제어하는 조절 가능한 Phase 및 Power 매개변수를 포함하여 Renko, 범위 및 가격 행동 트레이더에게 이상적입니다.
✅ 제로 지연 느낌
✅ 변동성 적응형
✅ 모든 시간대 및 차트 유형에서 작동
✅ 완전 맞춤형
요약
AI 요약
JMA-Like is an adaptive zero-lag moving average indicator designed to replicate the behavior of the original Jurik Moving Average (JMA). It features advanced smoothing algorithms that dynamically adjust to market volatility, reducing lag while filtering out noise. The indicator includes customizable Phase and Power parameters, allowing users to control responsiveness and overshoot. It is suitable for various trading styles, including trend-following and contrarian strategies, and works effectively on all timeframes and chart types such as Renko, range, and price action charts. Key features include a zero-lag feel, volatility adaptation, and full customization options.
지표 프로필
고객 리뷰
5.0
리뷰: 1
5 | 100 % | |
4 | 0 % | |
3 | 0 % | |
2 | 0 % | |
1 | 0 % |
고객 리뷰
상담
자주 묻는 질문(FAQ)
트레이딩 봇, 지표, 플러그인 등 cTrader Store에서 제공되는 상품은 제3자 개발자에 의해 제공되며, 이는 단순히 정보 및 기술적 접근을 목적으로 제공된 것입니다. cTrader Store는 중개인이 아니며, 투자 조언, 개인별 추천 또는 향후 성과에 대한 어떠한 보장도 제공하지 않습니다.
이 작성자의 상품 더 보기

좋아하실 만한 다른 항목


가격
가입일 16/07/2025
5
판매