
FVG & Imbalance Detector
Chỉ báo
2 lượt mua
Phiên bản 1.0, Jan 2026
Windows, Mac
4.0
Đánh giá: 2
Mô tả
Trong thế giới của Khái niệm Tiền Thông Minh (SMC) và ICT, sự mất cân bằng giá là "dấu vân tay" của các nhà đầu tư tổ chức lớn. Khi thị trường di chuyển quá nhanh, nó để lại phía sau một Khoảng cách Giá Công bằng (FVG)—một vùng không hiệu quả mà giá hầu như luôn quay lại để "lấp đầy" hoặc kiểm tra lại.
Công cụ FVG & Imbalance Detector cho cTrader là một công cụ hiệu suất cao được thiết kế để tự động phát hiện những vùng không hiệu quả này. Không còn phải vẽ thủ công nữa—nhận các vùng rõ ràng, có thể hành động trực tiếp trên biểu đồ của bạn.
Tại sao chỉ báo này là cần thiết:
- 🚀 Phát hiện các động thái tổ chức: Xem nơi các ngân hàng lớn và quỹ phòng hộ đã tham gia thị trường với khối lượng lớn.
- 🎯 Vùng xác suất cao: Sử dụng các vùng mất cân bằng đã xác định làm mục tiêu hút lợi nhuận hoặc như "Vùng Vàng" cho các điểm vào chính xác.
- 📈 Hiển thị rõ ràng: Các lớp phủ hình chữ nhật chất lượng cao giúp phân tích xu hướng trở nên dễ dàng.
- 🔧 Hoàn toàn linh hoạt: Khác với các chỉ báo cơ bản, phiên bản này cho phép bạn mở rộng vùng ra tương lai hoặc điều chỉnh điểm bắt đầu để phù hợp với chiến lược cụ thể của bạn.
Tính năng độc quyền:
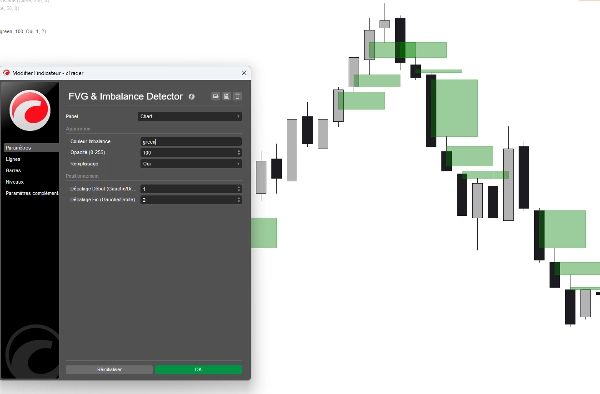
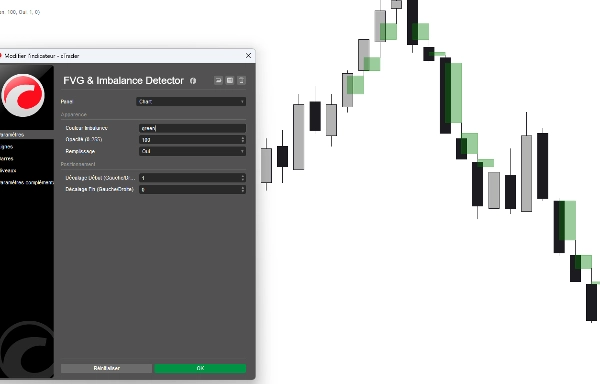
- Logic phát hiện thông minh: Thuật toán tiên tiến xác định cả các vùng không hiệu quả Đỉnh (Giảm giá) và Đáy (Tăng giá) với độ chính xác từng pixel.
- Độ lệch hai chiều: Các tham số độ lệch "Bắt đầu" và "Kết thúc" độc quyền cho phép bạn chiếu các vùng về phía trước hoặc phía sau để xem các khoảng trống lịch sử phù hợp với hành động giá hiện tại như thế nào.
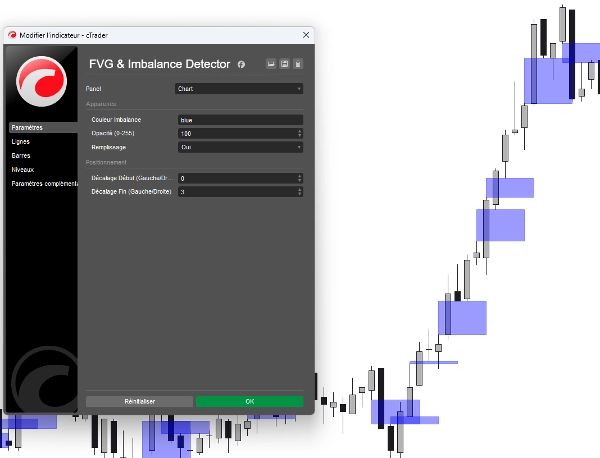
- Giao diện màu chuyên nghiệp: Chọn phong cách ưa thích qua menu thả xuống sạch sẽ (Vàng, Aqua, Đỏ, v.v.)—không còn phải gõ mã màu hex!
- Kiểm soát độ mờ: Điều chỉnh độ trong suốt để các vùng không làm rối mắt bạn khi xem hành động giá.
- Hiệu suất tối ưu: Mã nhẹ giúp không làm chậm nền tảng cTrader của bạn, ngay cả trên nhiều biểu đồ.
Cách sử dụng:
- Xác định Khoảng trống: Chỉ báo vẽ một hộp nơi xảy ra mất cân bằng giữa đỉnh của cây nến đầu tiên và đáy của cây nến thứ ba.
- Chờ kiểm tra lại: Quan sát giá quay lại các hộp này.
- Thực hiện: Tìm các mẫu từ chối trong vùng FVG để vào lệnh rủi ro thấp, lợi nhuận cao.
Tóm tắt
Tóm tắt AI
The FVG & Imbalance Detector is an indicator for the cTrader platform designed to identify Fair Value Gaps (FVG) and price imbalances, key concepts in Smart Money Concepts (SMC) and Institutional Cycle Trading (ICT). These gaps represent zones of market inefficiency created by rapid price moves, often reflecting institutional activity. The indicator automatically detects and highlights these zones on the chart with clear rectangular overlays, eliminating the need for manual drawing.
Key features include detection of both bullish (bottom) and bearish (top) imbalances with high precision, customizable zone extensions via start and end offset parameters, and adjustable opacity and color settings for clear visualization. The tool is optimized for performance to avoid slowing down the platform, even when applied to multiple charts.
Traders can use the indicator to spot where large institutional players have entered the market, identify high-probability zones for entries or take-profits, and monitor price retests of these inefficiency zones for potential trade execution. The indicator supports analysis across various markets including Forex, Indices, Commodities, and Crypto.
Hồ sơ chỉ báo
Đánh giá của khách hàng
4.0
Đánh giá: 2
5 | 0 % | |
4 | 100 % | |
3 | 0 % | |
2 | 0 % | |
1 | 0 % |
Đánh giá của khách hàng
January 18, 2026
tested small first and that felt like the right move, and account protection still comes first.
January 14, 2026
Thảo luận
Câu hỏi thường gặp
Forex
Indices
Commodities
Crypto
AI
Các sản phẩm có sẵn trên cTrader Store, bao gồm bot giao dịch, chỉ báo và plugin, được cung cấp bởi các nhà phát triển bên thứ ba và chỉ nhằm mục đích cung cấp thông tin và tiếp cận kỹ thuật. cTrader Store không phải là nhà môi giới và không cung cấp lời khuyên đầu tư, khuyến nghị cá nhân hay bất kỳ đảm bảo nào về hiệu suất trong tương lai.
Sản phẩm khác của tác giả này


Giá
Kể từ 27/10/2025
10
Lượt bán