
Mô tả
PHÂN TÍCH XU HƯỚNG là một chỉ báo kỹ thuật nâng cao cho nền tảng cTrader kết hợp nhiều phương pháp phân tích thành một giải pháp duy nhất. Được phát triển cho các nhà giao dịch tìm kiếm sự xác nhận xu hướng thông qua sự hội tụ của các chỉ báo, nó cung cấp một cái nhìn toàn diện về thị trường với các tín hiệu chính xác và bộ lọc xác nhận.
XEM VIDEO GIỚI THIỆU VỀ CHIẾN LƯỢC HOẠT ĐỘNG!
🎯 CHIẾN LƯỢC SỬ DỤNG
1. Giao dịch theo xu hướng
Ứng dụng: Xác định và theo dõi các xu hướng đã thiết lập
Khung thời gian: H4, D1 cho các vị thế dài hạn
Cài đặt: ADX > 25, Khối lượng trên mức trung bình
Quản lý rủi ro: Dừng lỗ dưới đường trung bình động 50 kỳ
2. Giao dịch Swing
Ứng dụng: Nắm bắt các biến động trung hạn
Khung thời gian: H1, H4
Cài đặt: Bộ lọc khối lượng được bật, xác nhận bằng Hồ sơ Khối lượng
Mục tiêu: Điểm kiểm soát (POC) của Hồ sơ Khối lượng làm TP
3. Giao dịch phá vỡ
Ứng dụng: Vào lệnh khi phá vỡ hỗ trợ/kháng cự
Cài đặt: Khối lượng PVA để xác nhận sức mạnh của chuyển động
Xác nhận: ADX tăng + Khối lượng trên mức trung bình
4. Scalping (Khung thời gian ngắn hơn)
Ứng dụng: Giao dịch nhanh với nhiều xác nhận
Khung thời gian: M1, M5
Cài đặt: Bộ lọc khối lượng nghiêm ngặt và Động lượng
🔧 CÁCH CÁC CHỈ BÁO HOẠT ĐỘNG
CORE ADX & DI
ADX (Chỉ số hướng trung bình)
Chức năng: Đo sức mạnh xu hướng
Diễn giải:
0-25: Xu hướng yếu/di chuyển ngang
25-50: Xu hướng mạnh
50+: Xu hướng rất mạnh
Sử dụng thực tế: Tránh giao dịch khi ADX < 20
+DI / -DI (Chỉ báo hướng)
+DI: Sức mạnh người mua
-DI: Sức mạnh người bán
Tín hiệu: Giao cắt của +DI vượt lên trên -DI (mua) và ngược lại
Độ dốc ADX (ADX Slope)
Chức năng: Đo tốc độ tăng xu hướng
Biểu diễn: Biểu đồ cột màu xanh lam nhạt
Tín hiệu: Giá trị dương cho thấy xu hướng đang mạnh lên
BỘ LỌC KHỐI LƯỢNG
Bộ lọc MA khối lượng
Chức năng: Xác nhận tín hiệu với khối lượng trên mức trung bình
Tham số: Chu kỳ 20, Hệ số nhân 1.0
Sử dụng: Xác nhận sự quan tâm của tổ chức
Khối lượng PVA (Phân tích Giá Khối lượng)
Màu sắc và Ý nghĩa:
Xanh lá: Mua với khối lượng rất cao (>150% trung bình)
Xanh dương: Mua với khối lượng cao
Đỏ: Bán với khối lượng rất cao
Hồng: Bán với khối lượng cao
Vàng: Pin Bar/Đuối sức với phá vỡ hỗ trợ
HỒ SƠ KHỐI LƯỢNG
POC (Điểm kiểm soát)
Chức năng: Giá có khối lượng giao dịch cao nhất
Sử dụng: Mục tiêu tự nhiên cho giao dịch, hỗ trợ/kháng cự động
Khu vực giá trị
Chức năng: Vùng mà 70% khối lượng được giao dịch
Diễn giải:
Giá trên: Xu hướng tăng
Giá dưới: Xu hướng giảm
Bên trong: Có thể di chuyển ngang
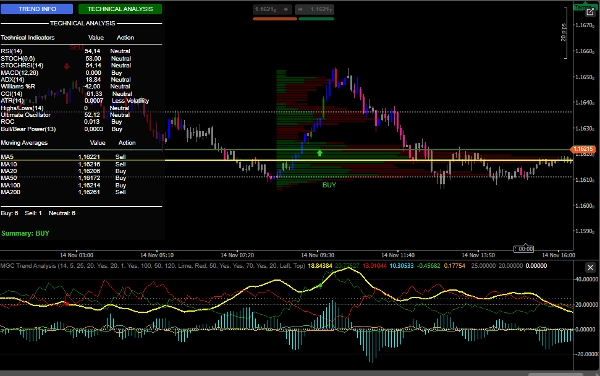
PHÂN TÍCH KỸ THUẬT TOÀN DIỆN
Bảng chỉ báo
RSI: Quá bán (<30) / Quá mua (>70)
MACD: Động lượng
Williams %R: Điều kiện cực đoan
CCI: Nhận diện đảo chiều
Stochastic: Động lượng ngắn hạn
Ultimate Oscillator: Động lượng đa khung thời gian
Đường trung bình động
Bộ đầy đủ các MA (5, 10, 20, 50, 100, 200)
Phân tích căn chỉnh cho xu hướng
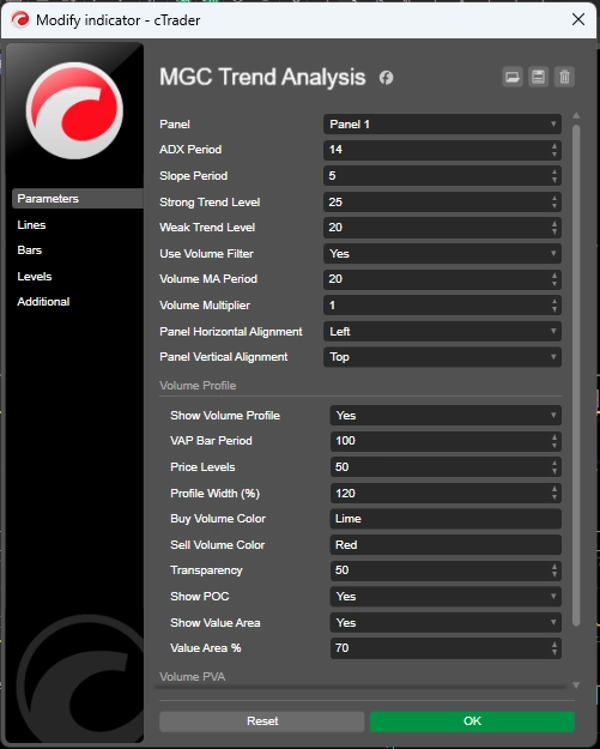
⚙️ CÀI ĐẶT ĐỀ XUẤT
Cài đặt bảo thủ
javascript
Chu kỳ ADX: 14
Chu kỳ độ dốc: 5
Mức xu hướng mạnh: 25
Mức xu hướng yếu: 20
Sử dụng bộ lọc khối lượng: true
Chu kỳ MA khối lượng: 20
Hệ số nhân khối lượng: 1.2
Cài đặt tích cực
javascript
Chu kỳ ADX: 10
Chu kỳ độ dốc: 3
Mức xu hướng mạnh: 20
Mức xu hướng yếu: 15
Sử dụng bộ lọc khối lượng: true
Chu kỳ MA khối lượng: 14
Hệ số nhân khối lượng: 1.0
Hồ sơ khối lượng (Đề xuất)
javascript
Hiển thị Hồ sơ Khối lượng: true
Chu kỳ thanh VAP: 100
Mức giá: 50
Phần trăm khu vực giá trị: 70
Hiển thị POC: true
🎨 TÀI NGUYÊN HÌNH ẢNH
Giao diện người dùng
Bảng điều khiển động: Thông tin thời gian thực
Nút tương tác: Chuyển đổi giữa các phân tích
Màu sắc trực quan: Mã hóa theo chức năng
Tín hiệu đồ họa
Mũi tên: Vào lệnh MUA/BÁN
Âm thanh: Cảnh báo nghe được
Màu thanh: Phân tích PVA tích hợp
Tóm tắt
Đánh giá của khách hàng
5 | 67 % | |
4 | 33 % | |
3 | 0 % | |
2 | 0 % | |
1 | 0 % |


