
Mô tả
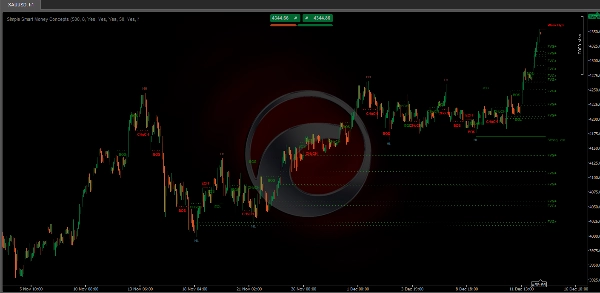
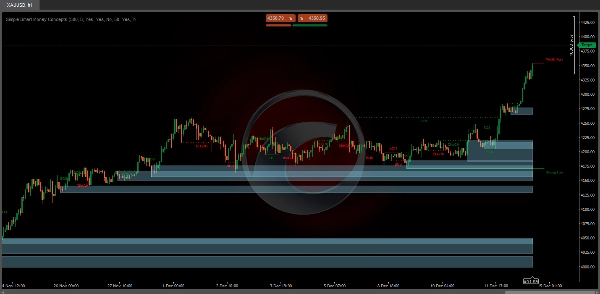
Chỉ báo Simple Smart Money Concepts này hiển thị cấu trúc thị trường theo thời gian thực (BOS / CHoCH nội bộ & swing), các khối lệnh, vùng cao cấp & giảm giá, các đỉnh & đáy bằng nhau, và nhiều hơn nữa... cho phép các nhà giao dịch tự động đánh dấu biểu đồ của họ với các phương pháp hành động giá được sử dụng rộng rãi.
"Smart Money Concepts" (SMC) là thuật ngữ được sử dụng trong số các nhà giao dịch hành động giá nhằm điều hướng thanh khoản chính xác hơn & tìm các điểm quan tâm tối ưu hơn trên thị trường. Cố gắng xác định nơi các thành phần thị trường tổ chức đã đặt lệnh có thể là một cách tiếp cận rất hợp lý để tìm các điểm vào & ra thực tế hơn dựa trên hành động giá.
Các Tính Năng Chính
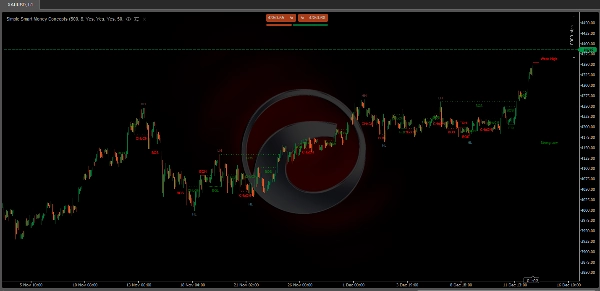
- Cấu trúc thị trường nội bộ và swing theo thời gian thực:
-
- Cấu trúc Nội bộ: Những yếu tố này đề cập đến các hình thành và mô hình giá xảy ra trong phạm vi nhỏ hơn hoặc một phiên giao dịch cụ thể. Bộ công cụ có thể phát hiện các chi tiết tinh vi như các mức hỗ trợ/kháng cự nhỏ hoặc sự đảo chiều xu hướng ngắn hạn.
- Cấu trúc Bên ngoài: Bao gồm các mô hình và xu hướng thị trường lớn hơn, quan trọng hơn trải dài qua nhiều phiên hoặc khung thời gian. Khả năng này giúp các nhà giao dịch hiểu được hướng đi tổng thể của thị trường.
- Các khu vực HH/LH/LL/LH:
-
- Xác định các Đỉnh Cao Hơn (HH), Đỉnh Thấp Hơn (LH), Đáy Thấp Hơn (LL), và Đỉnh Thấp Hơn (LH) giúp hiểu xu hướng và cấu trúc thị trường, hỗ trợ phân tích dự đoán.
- Phá vỡ Cấu trúc (BOS):
-
- Tính năng này xác định các điểm mà giá phá vỡ một cấu trúc quan trọng, có thể báo hiệu một xu hướng mới hoặc sự đảo chiều xu hướng.
- Thay đổi Tính cách (CHoCH):
-
- Phát hiện những thay đổi tinh tế trong hành vi thị trường, có thể gợi ý các giai đoạn đầu của sự thay đổi xu hướng trước khi chúng trở nên rõ ràng với thị trường rộng lớn hơn.
- Khối Lệnh:
-
- Đây về cơ bản là các mức giá hoặc vùng nơi các hoạt động giao dịch quan trọng đã diễn ra trước đó, có khả năng chỉ ra vị trí của tiền thông minh.
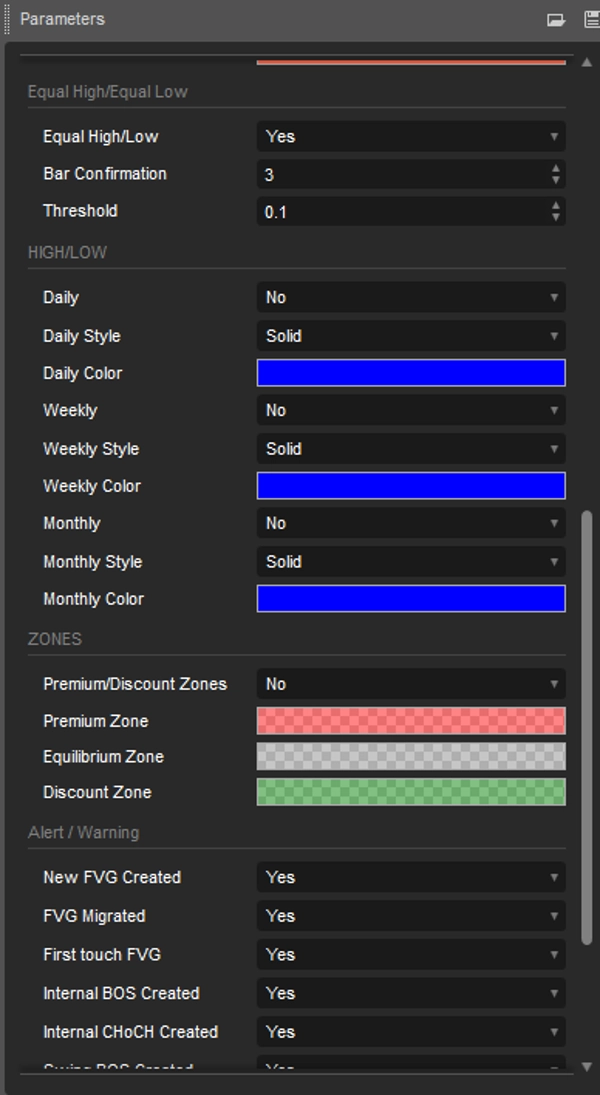
- Đỉnh và Đáy Bằng Nhau
-
- Hiển thị nhãn EQH/EQL trên biểu đồ để phát hiện các đỉnh & đáy bằng nhau.
- Khoảng trống Giá Trị Công Bằng:
-
- Khoảng trống Giá Trị Công Bằng: Một hình thành ba nến trong đó bóng nến liền kề với nến trung tâm không chồng lấp, điều này làm nổi bật một vùng khoảng trống.
- Các Đỉnh & Đáy Trước:
-
- Cho phép người dùng hiển thị các đỉnh & đáy trước đó từ các khung thời gian hàng ngày, hàng tuần, & hàng tháng như các mức quan trọng
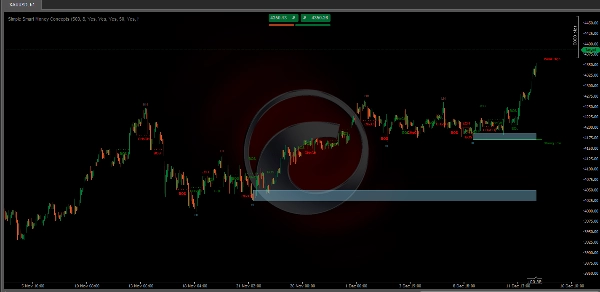
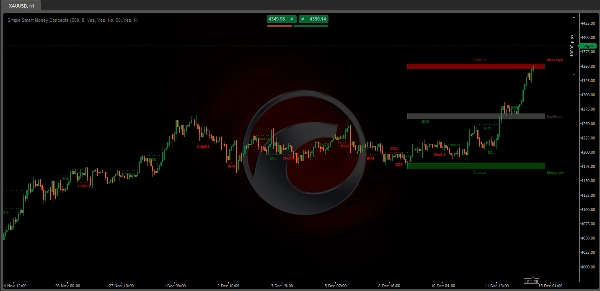
- Vùng Cao cấp & Giảm giá dưới dạng phạm vi:
-
- Cho phép người dùng hiển thị các vùng Cao cấp, Giảm giá, và Cân bằng trên biểu đồ
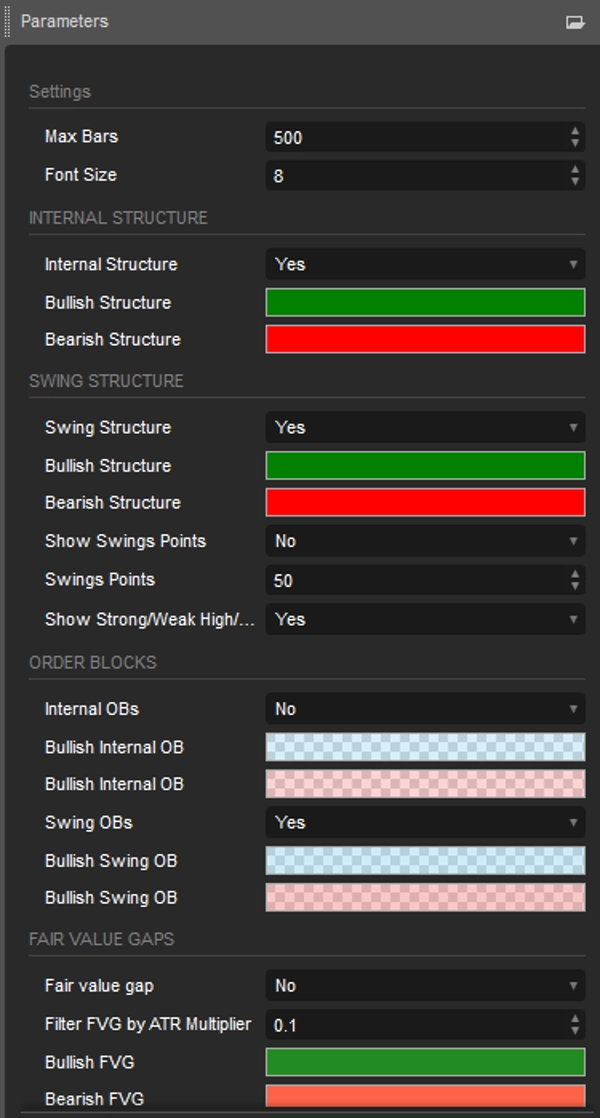
Các Tính Năng Có Thể Tùy Chỉnh
- Người dùng có thể điều chỉnh các cài đặt như độ dài dữ liệu, màu sắc, và kiểu hiển thị để phù hợp với sở thích giao dịch của họ.
Lợi Ích Cho Nhà Giao Dịch
- Tiết kiệm thời gian phân tích thủ công, nâng cao hiệu quả giao dịch.
- Giúp đưa ra quyết định nhanh chóng và có thông tin trong điều kiện thị trường biến động.
- Dễ sử dụng cho cả người mới bắt đầu và các nhà giao dịch có kinh nghiệm.
Kết Luận
Chỉ báo Simple Smart Money Concepts không chỉ là một công cụ mà còn là một giải pháp toàn diện cho các nhà giao dịch muốn triển khai hiệu quả các chiến lược ICT. Đây là một lựa chọn mạnh mẽ để nâng cao phân tích thị trường và thực hiện các giao dịch chính xác.
Tóm tắt
Additional features include the identification of equal highs and lows, fair value gaps (three-candle formations indicating price gaps), and previous highs and lows across daily, weekly, and monthly timeframes. It also displays premium, discount, and equilibrium zones to help traders assess value areas.
Users can customize settings such as data length, colors, and display styles to fit their trading preferences. The indicator supports analysis across multiple markets including Forex, cryptocurrencies (e.g., BTCUSD), stocks, and commodities (e.g., XAUUSD).
Designed to streamline chart analysis, the Simple Smart Money Concepts indicator aids traders in making informed decisions by visually representing widely used price action methodologies and institutional order flow concepts.
Đánh giá của khách hàng
5 | 33 % | |
4 | 67 % | |
3 | 0 % | |
2 | 0 % | |
1 | 0 % |


