
Description
Guide de l'utilisateur WinSMC
1. Objectif
`WinSMC` est un indicateur SMC en superposition pour cTrader. Il vous aide à identifier visuellement :
- Les changements de structure du marché
- `BOS` (Break of Structure)
- `MSS` (Market Structure Shift)
- `Order Blocks`
- `Liquidity Grabs` / `Sweeps`
- `FVG` (Fair Value Gaps)
Ce n'est pas un système de trading automatique. C'est un outil de structure et de contexte, mieux utilisé pour un trading basé sur la confirmation.
2. Concepts clés
Longueur du Swing
La `Longueur du Swing` contrôle à quelle distance à gauche et à droite un pivot doit être confirmé avant d'être considéré comme un point de swing valide.
Conseils pratiques :
- Valeurs plus petites = plus de signaux, plus de bruit
- Valeurs plus grandes = moins de signaux, structure plus propre
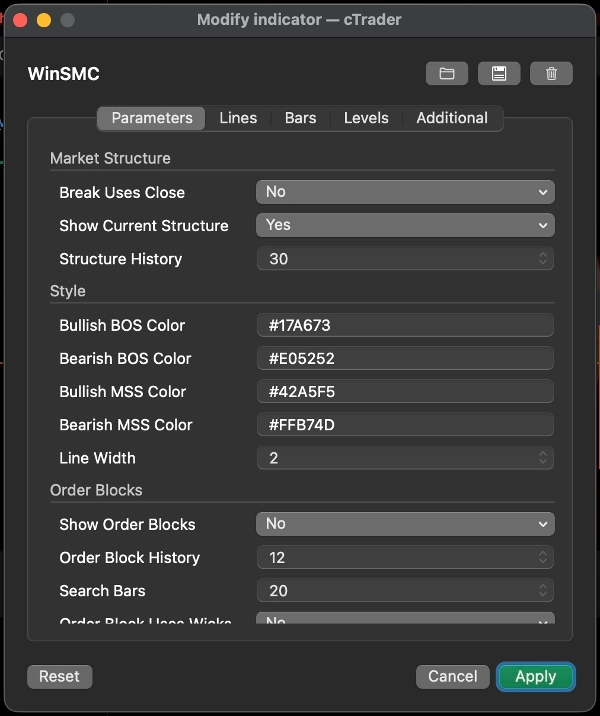
La cassure utilise la clôture
Ce paramètre décide si une cassure de structure est confirmée par :
- `Oui` : clôture de la bougie
- `Non` : cassure de mèche/bas/haut
Conseils :
- Utilisez la clôture pour une approche plus conservatrice
- Utilisez les cassures de mèche pour une détection plus précoce et plus sensible
Afficher la structure actuelle
Affiche les lignes de swing haut et bas actives actuelles, vous aidant à voir ce que le marché respecte encore.
Historique de la structure
Contrôle le nombre de lignes et d'étiquettes de cassure de structure conservées sur le graphique.
3. BOS et MSS
BOS
`BOS` signifie que le prix continue dans la même direction et casse le plus haut ou le plus bas précédent.
Interprétation typique :
- En tendance haussière, casser le plus haut précédent est un BOS haussier
- En tendance baissière, casser le plus bas précédent est un BOS baissier
MSS
`MSS` signifie que le marché a changé de direction par rapport au biais précédent.
Interprétation typique :
- Si le prix était baissier et casse un plus haut précédent, c'est un MSS haussier
- Si le prix était haussier et casse un plus bas précédent, c'est un MSS baissier
Utilisation en trading
- `BOS` est plus orienté continuation de tendance
- `MSS` est plus orienté retournement
- Les meilleures entrées viennent généralement d'un retest d'un `Order Block` ou `FVG`
4. Order Blocks
Un `Order Block` est la dernière bougie opposée avant une cassure de structure. Il est couramment traité comme une zone de réaction offre/demande.
Afficher les Order Blocks
Lorsqu'il est activé, l'indicateur regarde en arrière après un `BOS` ou `MSS` et dessine la zone de la dernière bougie opposée.
Signification
- OB haussier : après une cassure haussière, la dernière bougie baissière est utilisée
- OB baissier : après une cassure baissière, la dernière bougie haussière est utilisée
Lorsque le prix commence à interagir avec la zone, elle est marquée comme atténuée.
L'Order Block utilise les mèches
Cela contrôle la largeur de la boîte dessinée :
- `Oui` : utilise toute la plage de la bougie, zone plus large
- `Non` : utilise une zone centrale plus serrée
Conseils :
- Utilisez `Oui` pour une zone plus large et plus conservatrice
- Utilisez `Non` pour une zone plus étroite et plus précise
Stratégie Order Block
Flux de travail courant :
1. Attendre un `BOS` ou `MSS`
2. Marquer l'OB correspondant
3. Attendre le retest
4. Chercher une confirmation avant d'entrer
Ne considérez pas l'OB comme un point de retournement garanti. C'est une zone d'intérêt élevé, pas une certitude.
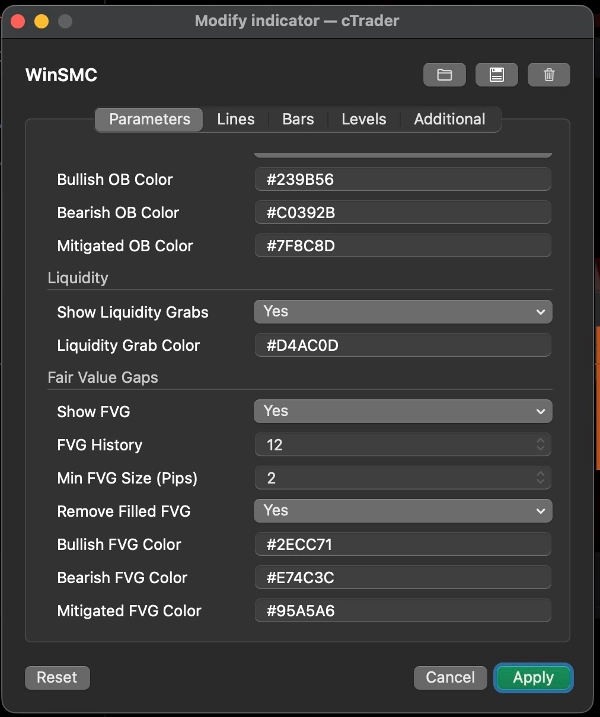
5. Liquidity Grabs / Sweeps
Un `Liquidity Grab` signifie que le prix dépasse un plus haut précédent ou descend en dessous d'un plus bas précédent, puis clôture à l'intérieur.
Dans cet indicateur :
- `Balayage côté achat` : le prix dépasse le plus haut précédent puis clôture en dessous
- `Balayage côté vente` : le prix descend en dessous du plus bas précédent puis clôture au-dessus
Cela signifie généralement que le marché a capturé de la liquidité et peut se préparer pour le prochain mouvement.
Important
Un balayage seul n'est pas un signal de trading.
Il est mieux traité comme :
- Un avertissement que la liquidité a été prise
- Un indice de configuration
- Une raison d'attendre un `MSS` ou `BOS`
Utilisation courante
- Après un `balayage côté achat`, un `MSS` baissier peut soutenir une configuration de vente
- Après un `balayage côté vente`, un `MSS` haussier peut soutenir une configuration d'achat
6. FVG
`FVG` est un Fair Value Gap créé par un déséquilibre de trois bougies.
Afficher FVG
Lorsqu'il est activé, l'indicateur dessine des zones FVG visibles.
Règle de détection
- FVG haussier : le plus haut de la première bougie est en dessous du plus bas de la troisième bougie
- FVG baissier : le plus bas de la première bougie est au-dessus du plus haut de la troisième bougie
Taille minimale FVG (pips)
Cela filtre les gaps minuscules.
- Unité : `pips`
- Valeur plus élevée = moins de FVG mais plus significatifs
- `0` = pas de filtre de taille
Utile lorsque le graphique est encombré ou lorsque de minuscules gaps d'un pixel ne sont pas utiles pour votre flux de travail.
Supprimer les FVG comblés
Lorsqu'il est activé, les FVG entièrement comblés sont retirés du graphique.
Stratégie FVG
Deux approches courantes :
1. Retracement de tendance
- Attendre un `BOS` ou `MSS`
- Attendre que le prix retrace dans le FVG
- Trader dans la direction de la structure
2. Entrée basée sur la confirmation
- Surveiller un balayage
- Attendre un `MSS`
- Utiliser le FVG comme zone finale de retracement
7. Styles de trading recommandés
Stratégie A : Continuation de tendance
Idéal lorsque le marché est clairement en tendance.
Flux de travail :
1. Attendre un `BOS`
2. Marquer l'OB
3. Chercher un retracement dans l'OB ou le FVG
4. Entrer uniquement après réaction du prix
C'est une approche classique de suivi de tendance.
Stratégie B : Balayage puis retournement
Idéal lorsque le marché est volatile et sujet aux fausses cassures.
Flux de travail :
1. Détecter un `balayage côté achat` ou `balayage côté vente`
2. Attendre le `MSS` opposé
3. Utiliser l'OB ou le FVG comme zone de retracement
4. Entrer après confirmation
C'est plus fort que de trader le balayage seul.
Stratégie C : Confluence Balayage + MSS + OB/FVG
C'est l'une des manières les plus claires d'utiliser l'indicateur.
Flux de travail :
1. Obtenir un balayage
2. Obtenir un MSS
3. Attendre un retest OB ou FVG
4. Trader uniquement lorsque les zones se chevauchent
Cela réduit les entrées prématurées.
8. Suggestions rapides de paramètres
- `Longueur du Swing` : commencer avec 5 ou 7
- `La cassure utilise la clôture` : activer pour une vue plus conservatrice
- `L'Order Block utilise les mèches` : activer pour des zones plus larges
- `Taille minimale FVG (pips)` : commencer à 2.0 et ajuster selon l'instrument
- `Historique de la structure` / `Historique des Order Blocks` / `Historique des FVG` : ajuster pour garder le graphique lisible
9. Note finale
`WinSMC` est mieux utilisé comme une carte de structure, pas comme un déclencheur à signal unique.
Le flux de travail le plus fiable est :
- Identifier la direction de la tendance
- Surveiller le balayage de liquidité
- Attendre un MSS ou BOS
- Utiliser OB ou FVG comme zone d'entrée
- Entrer uniquement après confirmation
Résumé
The indicator helps traders analyze price action by marking swing highs and lows, confirming valid swing points based on customizable swing length, and distinguishing breaks using candle closes or wick extremes. Order Blocks are displayed as supply/demand zones derived from the last opposite candle before a structure break, with options to adjust zone width. Liquidity Sweeps indicate price movements beyond prior highs or lows that close back inside, signaling potential setups rather than direct trade signals. FVG zones are identified by three-candle imbalances and can be filtered by minimum size and removed once filled.
WinSMC supports multiple trading strategies, including trend continuation after BOS, reversal setups following liquidity sweeps and MSS, and confluence-based entries combining sweeps, MSS, and retests of Order Blocks or FVGs. It is intended as a confirmation and structure mapping tool rather than an automated trading system, aiding traders in timing entries with contextual market information.

![Logo de "[CB] Pivot Points Pro"](https://cdn.ctrader.com/image/webp/43463c82-67b0-4f10-a4ba-901bba091d81_32594)


