
LT Flexible Volume Profile
อินดิเคเตอร์
12 การซื้อ
เวอร์ชัน 1.0, Sep 2024
Windows, Mac
5.0
รีวิว: 3
คำอธิบาย
หมายเหตุ: ทดสอบบน cTrader Windows เท่านั้น
โปรไฟล์ปริมาณ
โปรไฟล์แนวตั้งที่วาดในกราฟราคาเพื่อแสดงว่าราคาที่ใดมีปริมาณมาก/น้อย (ความสนใจในการซื้อขาย)
ตัวบ่งชี้โปรไฟล์ปริมาณที่ยืดหยุ่น
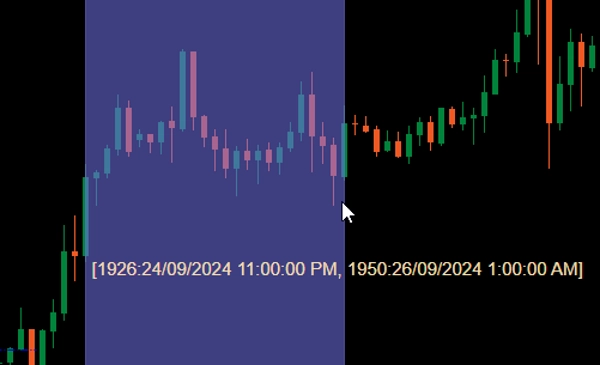
เมื่อเพิ่มลงในกราฟของคุณ ให้กด Ctrl แล้วลากเมาส์ซ้ายบนพื้นที่ในกราฟราคาเพื่อวาดโปรไฟล์สำหรับพื้นที่นั้น
เพื่อประสิทธิภาพ โปรไฟล์จะถูกวาดใน 2 สถานะ:
- โปรไฟล์หยาบ: ตัวบ่งชี้จะใช้กรอบเวลาที่กำหนดโดย CoarseTF (ค่าเริ่มต้น m5) เพื่อโหลดข้อมูลปริมาณ ซึ่งโดยปกติจะรวดเร็ว ในขณะที่โปรไฟล์หยาบแสดงอยู่ โปรไฟล์ละเอียดจะถูกโหลดเบื้องหลัง
- โปรไฟล์ละเอียด: โปรไฟล์ที่แม่นยำมากขึ้น ซึ่งใช้กรอบเวลาที่กำหนดโดย FineTF (ค่าเริ่มต้น m1) แต่คุณสามารถตั้งค่าให้ละเอียดที่สุด (t1 - ทีละทิกเดียว) อย่างไรก็ตาม หากคุณดูกราฟกรอบเวลารายวันหรือยาวกว่า การตั้งค่าเป็นกรอบเวลาทิกจะเพิ่มเวลาการโหลด
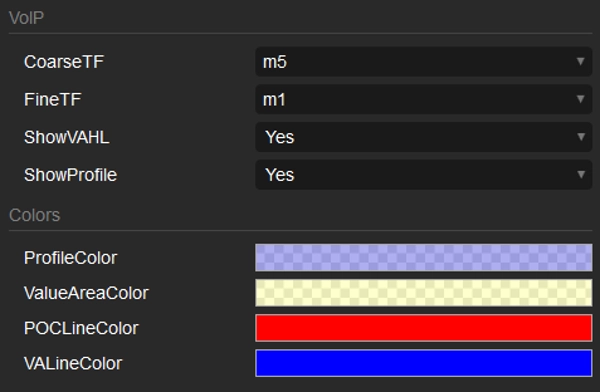
พารามิเตอร์
- CoarseTF: กรอบเวลาสำหรับข้อมูลหยาบ (ค่าเริ่มต้น m5)
- FineTF: กรอบเวลาสำหรับข้อมูลละเอียด (ค่าเริ่มต้น m1)
- ShowVAHL: แสดง VAH (Value Area High) และ VAL (Value Area Low)
- ShowProfile: หากเลือกใช่จะแสดงโปรไฟล์เต็ม มิฉะนั้นจะแสดงเฉพาะ VAH, VAL และ POC (จุดควบคุม)
- Colors: การปรับแต่งสี
วิธีใช้
หลังจากเพิ่มตัวบ่งชี้ลงในกราฟราคา ใช้ Ctrl ลากเมาส์ซ้ายเพื่อเลือกพื้นที่ในกราฟที่คุณต้องการสร้างโปรไฟล์ เพียงเท่านี้
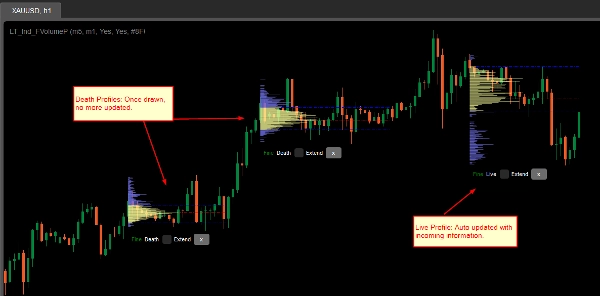
หลังจากโปรไฟล์ถูกแสดง คุณจะเห็นข้อมูล/การจัดการบางอย่างที่ด้านล่างของโปรไฟล์:
- หยาบ/ละเอียด: สถานะของโปรไฟล์
- ตาย/สด: หากโปรไฟล์ของคุณครอบคลุมแท่งเทียนล่าสุด จะเป็นโปรไฟล์สดและอัปเดตโดยอัตโนมัติด้วยข้อมูลที่เข้ามา
- ช่องทำเครื่องหมายขยาย: เลือกเพื่อให้เส้น VAH, VAL และ POC ขยายไปยังแท่งเทียนล่าสุด
- ปุ่ม x: คลิกเพื่อลบโปรไฟล์ออกจากกราฟ
สรุป
สรุปโดย AI
LT Flexible Volume Profile is a volume profile indicator designed for use on price charts, primarily tested on cTrader Windows. It visually represents trading volume distribution across price levels within a selected chart area, highlighting where trading interest is higher or lower.
Users activate the profile by holding Ctrl and dragging the mouse over a desired chart region. The indicator operates in two modes for performance optimization: a Coarse profile using a configurable timeframe (default 5 minutes) for faster loading, and a Fine profile using a finer timeframe (default 1 minute, with an option down to single ticks) for more precise volume data.
Key parameters include:
- CoarseTF and FineTF: timeframes for coarse and fine volume data aggregation.
- ShowVAHL: toggles display of Value Area High (VAH) and Value Area Low (VAL).
- ShowProfile: controls whether the full profile or only key levels (VAH, VAL, Point of Control) are shown.
- Colors: customizable color settings.
After rendering, the profile provides status indicators (Coarse/Fine, Live/Dead), options to extend VAH, VAL, and POC lines to the latest bar, and the ability to remove the profile. This tool supports detailed volume analysis to assist traders in identifying significant price levels based on traded volume.
โปรไฟล์อินดิเคเตอร์
รีวิวจากลูกค้า
5.0
รีวิว: 3
5 | 100 % | |
4 | 0 % | |
3 | 0 % | |
2 | 0 % | |
1 | 0 % |
รีวิวจากลูกค้า
October 1, 2024
Sensible product to test around volume based context. The useful part is checking participation, value areas and pressure, with the numbers checked before scaling. I would review 20 reactions near POC or VWAP before trusting the read. The data helps most when price action confirms the same zone.
September 30, 2024
September 30, 2024
Good tool for patience if the trader wants it adds useful information behind the price move. It works best as support, not a final decision maker. Volume context is stronger when POC, VWAP and value area agree across 2 sessions. volume alone can be noisy without price action.
การสนทนา
คำถามที่พบบ่อย
Forex
ผลิตภัณฑ์ที่มีให้บริการผ่าน cTrader Store รวมถึงบอทการเทรด อินดิเคเตอร์ และปลั๊กอิน มีให้บริการโดยนักพัฒนาบุคคลที่สามและมีไว้เพื่อวัตถุประสงค์ในการเข้าถึงข้อมูลและทางเทคนิคเท่านั้น cTrader Store ไม่ใช่โบรกเกอร์และไม่ได้ให้คำแนะนำการลงทุน คำแนะนำส่วนบุคคล หรือการรับประกันผลการดำเนินงานในอนาคต


ราคา
ตั้งแต่ 25/09/2024
34
การขาย