
Inside Candle
Indicatore
1 acquisti
Versione 1.0, Oct 2025
Windows, Mac
5.0
Recensioni: 2
Da 11/10/2025
2.55M
Volume negoziato
17.52K
Profitto in pip
1
Vendite
230
Installazioni gratuite
Descrizione
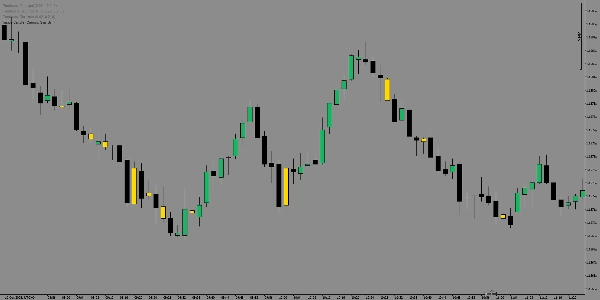
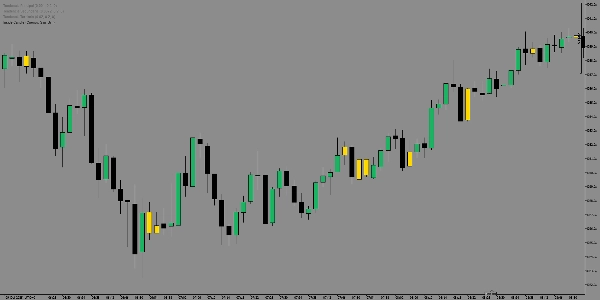
Identifica con precisione potenti zone di breakout e consolidamenti di mercato utilizzando il Indicatore Inside Candle.
Questo strumento evidenzia ogni pattern Inside Bar — momenti in cui la volatilità si contrae e il mercato si prepara a un movimento esplosivo.
Rilevando quando il massimo e il minimo di una candela sono completamente contenuti all’interno della precedente, segna visivamente aree di accumulazione o indecisione, aiutandoti ad anticipare potenziali punti di breakout prima che si verifichino.
Usalo per:
- Individuare configurazioni di continuazione del trend e inversioni anticipate.
- Filtrare le operazioni in base alle zone di compressione della volatilità.
- Riconoscere istantaneamente quando il mercato sta “accumulando energia” per la mossa successiva.
Pulito, preciso e visivamente intuitivo — l’Indicatore Inside Candle trasforma la complessa struttura del mercato in semplici intuizioni visive.
Riepilogo
Riepilogo AI
The Inside Candle indicator identifies Inside Bar patterns by detecting when a candle’s high and low are fully contained within the previous candle. This highlights zones of market consolidation and volatility contraction, signaling potential breakout points. It visually marks areas of accumulation or indecision, helping traders anticipate trend continuations or early reversals. The indicator supports markets including Forex, commodities, indices, and symbols such as EURUSD, GBPUSD, USDJPY, BTCUSD, XAUUSD, and NAS100. Key features include filtering trades by volatility compression zones and providing clear, intuitive visual cues to recognize when the market is preparing for significant moves. This tool is designed to simplify complex market structures into actionable insights for breakout and trend-following strategies.
Profilo indicatore
Recensioni dei clienti
5.0
Recensioni: 2
5 | 100 % | |
4 | 0 % | |
3 | 0 % | |
2 | 0 % | |
1 | 0 % |
Recensioni dei clienti
October 22, 2025
October 21, 2025
The better read comes from the process slows down in a good way. It should stay in the support stack.
Discussioni
Domande frequenti
BTCUSD
Forex
Signal
Breakout
Indices
EURUSD
Commodities
GBPUSD
NZDUSD
RSI
Fibonacci
Scalping
XAUUSD
NAS100
ATR
MACD
USDJPY
VWAP
I prodotti disponibili tramite cTrader Store, inclusi bot di trading, indicatori e plugin, sono forniti da sviluppatori terzi e resi disponibili esclusivamente a scopo informativo e di accesso tecnico. cTrader Store non è un broker e non fornisce consulenze in materia di investimento, raccomandazioni individualizzate o garanzie di risultati futuri.
Altro da questo autore


Prezzo
Da 11/10/2025
2.55M
Volume negoziato
17.52K
Profitto in pip
1
Vendite
230
Installazioni gratuite