
Sniper Zone Pro
อินดิเคเตอร์
3 การซื้อ
เวอร์ชัน 1.0, Jan 2026
Windows, Mac
4.6
รีวิว: 3
คำอธิบาย
ตัวบ่งชี้ Sniper Zone Pro
The Sniper Zone Pro เป็นเครื่องมือวิเคราะห์ขั้นสูงที่ออกแบบมาเพื่อระบุรอยเท้าของสถาบันขนาดใหญ่บนแผนภูมิราคาอย่างชัดเจน มันผสมผสานการทำแผนที่ โซนที่ไม่แน่ใจในอดีต กับระบบการระบายสีแท่งเทียนที่เปิดเผยการเคลื่อนไหวที่ถูกควบคุมและความแข็งแกร่งของสถาบัน ตัวบ่งชี้นี้เปลี่ยนความวุ่นวายของตลาดให้เป็นพื้นที่ปฏิบัติการที่ชัดเจน ช่วยให้นักเทรดสามารถระบุได้อย่างแม่นยำว่าราคานั้น "ต่อสู้" ที่ไหนและที่ไหนที่มีแนวโน้มจะทดสอบก่อนการขยายตัวใหม่
คุณสมบัติหลักของ Sniper Zone Pro
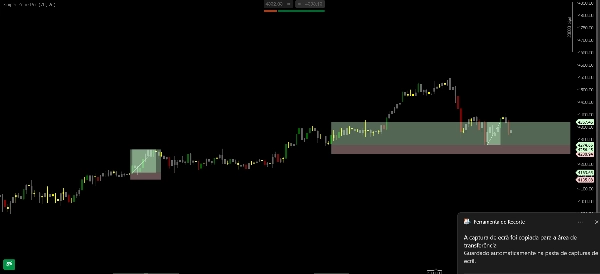
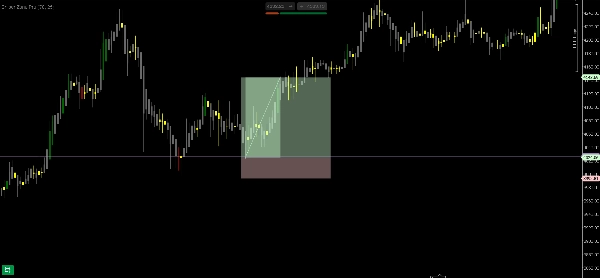
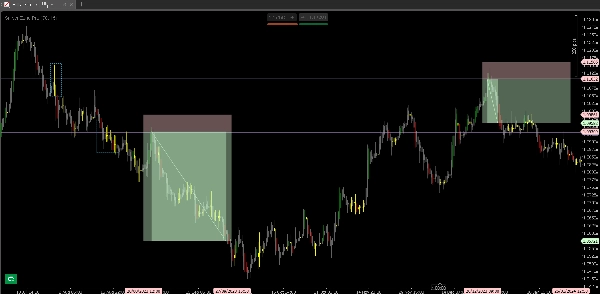
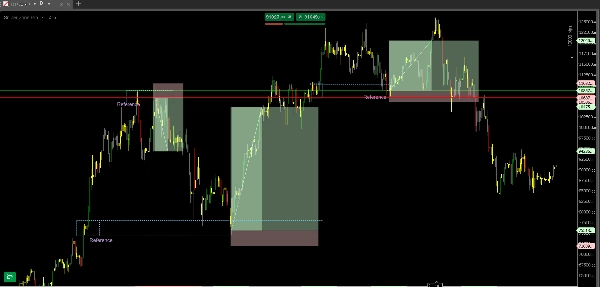
- การทำแผนที่ "โซนการต่อสู้": ระบุพื้นที่ที่ไม่แน่ใจโดยอัตโนมัติซึ่งราคาสะสมปริมาณ พื้นที่เหล่านี้กลายเป็น "โซนปฏิบัติการ" ที่สำคัญ เนื่องจากเป็นระดับราคาที่มีการโต้แย้งอย่างมากระหว่างผู้ซื้อและผู้ขาย
- การระบายสีสถาบันที่ใช้งาน: ระบบสีไม่ใช่แค่ความสวยงามเท่านั้น แต่เน้นแท่งเทียนที่มีลักษณะการเคลื่อนไหวของสถาบัน (เช่น ปริมาณสูงหรือการดูดซับ) แยกเสียงรบกวนของตลาดออกจากเจตนาของผู้เล่นรายใหญ่
- โซนทดสอบที่มีความน่าจะเป็นสูง: เมื่อถึงพื้นที่สำคัญ ตัวบ่งชี้ช่วยให้เห็นภาพว่าราคากำลังทดสอบโซนนั้นหรือพร้อมที่จะทะลุผ่าน ซึ่งช่วยให้มีสัญญาณเข้าเทรดที่แม่นยำมากขึ้น
- ตัวกรองลำดับชั้น (HTF): ให้ความสำคัญกับโซนที่น่าสนใจในกรอบเวลาที่สูงกว่า ซึ่งการต่อสู้ของราคามีความสำคัญทางเทคนิคมากขึ้นและมีศักยภาพในการกลับตัวที่สูงกว่าอย่างมีนัยสำคัญ
ทำไมต้องใช้ Sniper Zone Pro?
- การอ่านเจตนาตลาด: โดยการสังเกตสีแท่งเทียนภายในโซนการต่อสู้ นักเทรดสามารถระบุได้ว่าสถาบันกำลังปกป้องตำแหน่งนั้นหรือกำลังละทิ้ง
- การกำหนดโซนปฏิบัติการ: ขจัดความสงสัยเกี่ยวกับ "จะเทรดที่ไหน" ตัวบ่งชี้แสดงให้เห็นว่าโอกาสที่ดีที่สุดไม่ได้อยู่กลางการเคลื่อนไหว แต่เป็นในการทดสอบโซนที่ราคามีความไม่แน่ใจมาก่อน
- ลดความเป็นอัตวิสัย: นักเทรดหยุดพยายาม "เดา" จุดสูงสุดและต่ำสุด และเริ่มดำเนินการตามพื้นที่ที่ได้รับการพิสูจน์ว่ามีความสนใจจากมืออาชีพ
สรุป
สรุปโดย AI
Sniper Zone Pro is an advanced trading indicator designed to visually identify institutional activity on price charts by mapping past indecision zones and applying a candle coloring system that highlights market manipulation and institutional strength. It automatically detects "battle zones" where price accumulated volume, marking key operational areas of buyer-seller disputes. The indicator’s color-coded candles reveal institutional movements such as high volume or absorption, helping traders distinguish significant market actions from noise. It also highlights high-probability test zones, indicating whether price is testing or ready to break through these critical levels. A hierarchy filter prioritizes zones from higher timeframes, emphasizing areas with greater technical relevance. Sniper Zone Pro supports multiple markets including Forex, cryptocurrencies, stocks, commodities, and indices, with tags referencing symbols like BTCUSD, EURUSD, GBPUSD, XAUUSD, NAS100, and USDJPY. The tool aids traders in reading market intent by showing institutional defense or abandonment of price levels, defining precise operating zones to reduce subjectivity, and focusing trading decisions on professional interest areas rather than arbitrary price points.
โปรไฟล์อินดิเคเตอร์
รีวิวจากลูกค้า
4.6
รีวิว: 3
5 | 67 % | |
4 | 33 % | |
3 | 0 % | |
2 | 0 % | |
1 | 0 % |
รีวิวจากลูกค้า
January 19, 2026
The best part is random clicks become easier to catch, and a 1R exit plan makes review easier.
January 14, 2026
H1 makes the signal less noisy, and it adds a useful layer without forcing action.
January 5, 2026
No reason to yolo this live without a few normal sessions. The result needs a journal.
การสนทนา
คำถามที่พบบ่อย
BTCUSD
Forex
Signal
Breakout
Indices
EURUSD
Commodities
GBPUSD
NZDUSD
Scalping
Crypto
Stocks
XAUUSD
NAS100
USDJPY
ผลิตภัณฑ์ที่มีให้บริการผ่าน cTrader Store รวมถึงบอทการเทรด อินดิเคเตอร์ และปลั๊กอิน มีให้บริการโดยนักพัฒนาบุคคลที่สามและมีไว้เพื่อวัตถุประสงค์ในการเข้าถึงข้อมูลและทางเทคนิคเท่านั้น cTrader Store ไม่ใช่โบรกเกอร์และไม่ได้ให้คำแนะนำการลงทุน คำแนะนำส่วนบุคคล หรือการรับประกันผลการดำเนินงานในอนาคต


ราคา
ตั้งแต่ 11/07/2025
3
การขาย