
Stochastic RSI PRO
อินดิเคเตอร์
1 การซื้อ
เวอร์ชัน 1.0, Nov 2025
Windows, Mac
4.7
รีวิว: 4
คำอธิบาย
แนะนำ Stochastic RSI PRO สำหรับ cTrader ซึ่งเป็นเวอร์ชันขั้นสูงและปรับแต่งได้อย่างมากของตัวชี้วัด Stochastic RSI ที่ออกแบบมาเพื่อเพิ่มความแม่นยำในการเทรดของคุณ
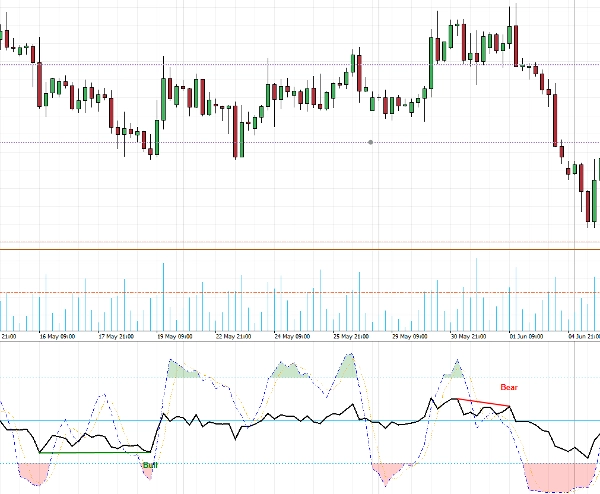
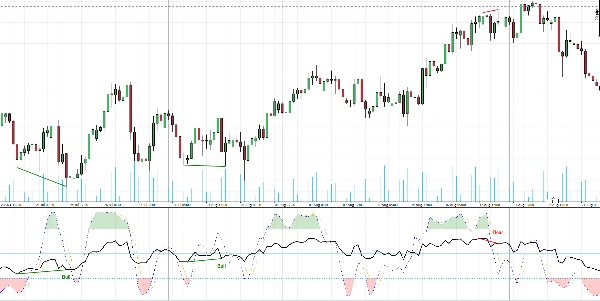
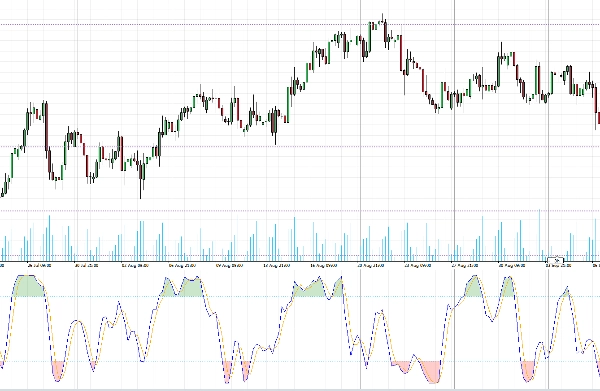
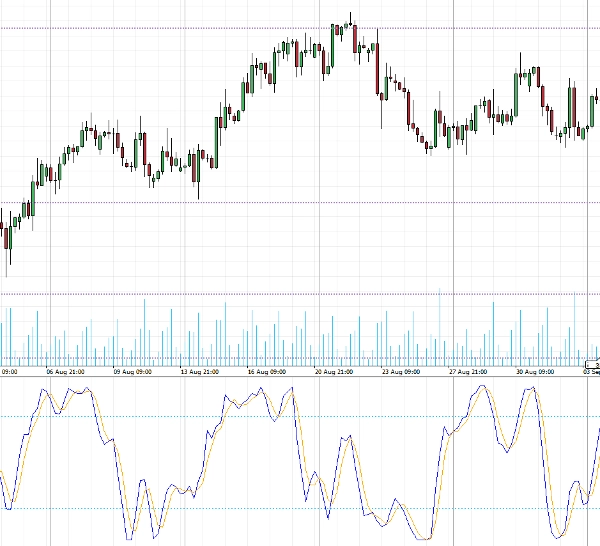
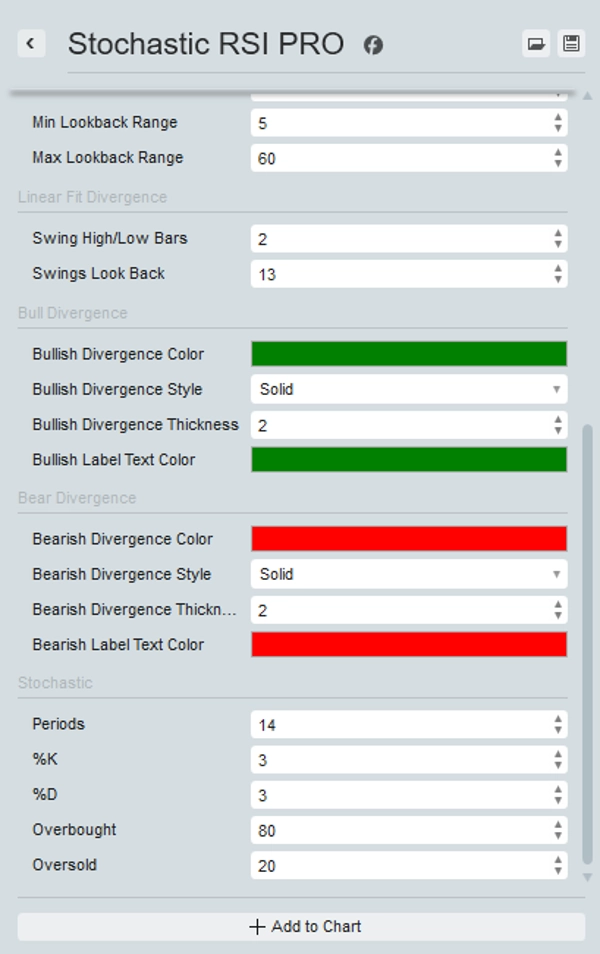
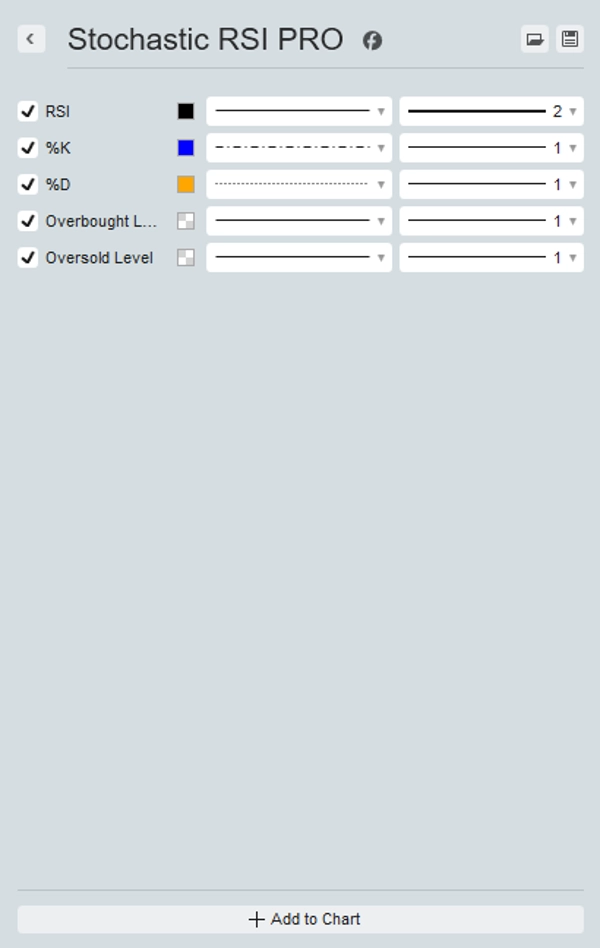
เครื่องมือทรงพลังนี้จะซ้อน RSI โดยตรงบน Stochastic RSI เพื่อให้มุมมองที่ครอบคลุมเกี่ยวกับโมเมนตัมของตลาด มันเน้นพื้นที่ที่ซื้อมากเกินไปและขายมากเกินไปด้วยสีที่แตกต่างกันเพื่อให้ง่ายต่อการระบุ
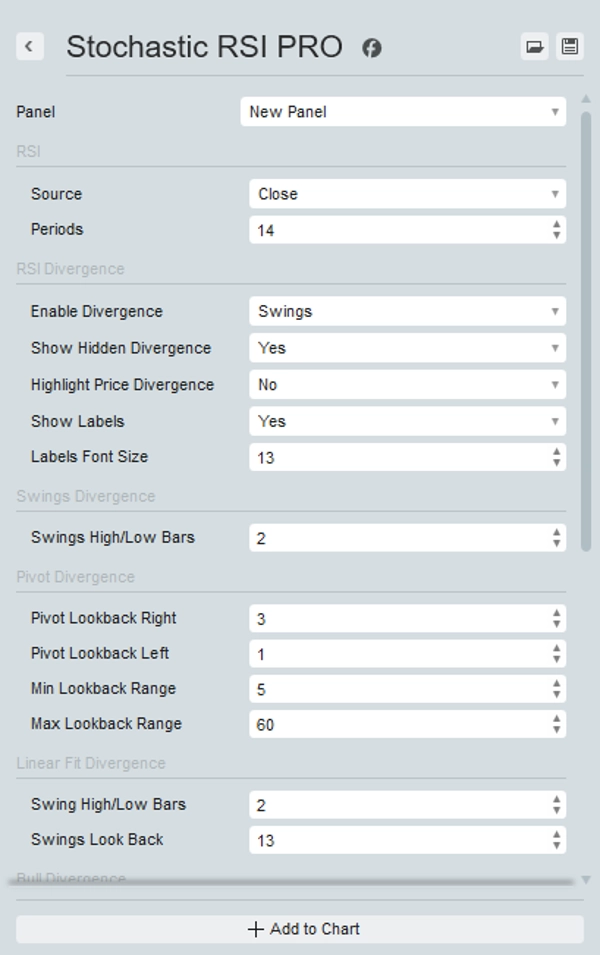
คุณสมบัติเด่นของ Stochastic RSI PRO คือความสามารถในการระบุและเน้นทั้ง divergences ปกติและซ่อนเร้นบนกราฟได้ตามต้องการ คุณสามารถเลือกจากสามวิธีในการระบุ divergences ได้แก่ Swing, Pivot หรือ Linear Fit โดยแต่ละวิธีมีการตั้งค่าที่ปรับแต่งได้เพื่อให้ตรงกับกลยุทธ์การเทรดของคุณ
ยกระดับการวิเคราะห์และการตัดสินใจของคุณด้วย Stochastic RSI PRO เครื่องมือที่จำเป็นสำหรับนักเทรดที่มีวิจารณญาณ
สรุป
สรุปโดย AI
Stochastic RSI PRO is an advanced indicator for the cTrader platform that overlays the Relative Strength Index (RSI) onto the Stochastic RSI to provide a detailed view of market momentum. It visually highlights overbought and oversold zones with customizable color coding for easier interpretation. The indicator features the ability to detect and optionally highlight both regular and hidden divergences on price charts. Users can select from three divergence detection methods—Swing, Pivot, or Linear Fit—each offering customizable settings to align with individual trading strategies. This tool supports analysis across multiple markets including Forex, cryptocurrencies, commodities, indices, and stocks, with specific symbol tags such as BTCUSD, EURUSD, GBPUSD, XAUUSD, NAS100, and USDJPY. Stochastic RSI PRO is designed to enhance precision in trade analysis by combining momentum indicators and divergence signals in a single, customizable interface.
โปรไฟล์อินดิเคเตอร์
รีวิวจากลูกค้า
4.7
รีวิว: 4
5 | 75 % | |
4 | 25 % | |
3 | 0 % | |
2 | 0 % | |
1 | 0 % |
รีวิวจากลูกค้า
February 25, 2026
Stochastic RSI PRO adds serious depth to the classic StochRSI by overlaying RSI and offering three divergence detection modes (Swing, Pivot, Linear Fit). Signals are clean on M5-H4, with the best structure on H1 and above. Flexible, customizable and practical for momentum and divergence-based strategies. A solid upgrade over standard StochRSI.
November 25, 2025
November 17, 2025
the part worth keeping is the trade idea gets a short cooling period. It should not be treated as the full answer.
November 13, 2025
What stood out was the opening read should not drive the only input, and It needs a boring test before bigger size.
การสนทนา
คำถามที่พบบ่อย
BTCUSD
Forex
Signal
Indices
EURUSD
Commodities
GBPUSD
NZDUSD
RSI
Prop
Scalping
Crypto
Stocks
XAUUSD
NAS100
USDJPY
ผลิตภัณฑ์ที่มีให้บริการผ่าน cTrader Store รวมถึงบอทการเทรด อินดิเคเตอร์ และปลั๊กอิน มีให้บริการโดยนักพัฒนาบุคคลที่สามและมีไว้เพื่อวัตถุประสงค์ในการเข้าถึงข้อมูลและทางเทคนิคเท่านั้น cTrader Store ไม่ใช่โบรกเกอร์และไม่ได้ให้คำแนะนำการลงทุน คำแนะนำส่วนบุคคล หรือการรับประกันผลการดำเนินงานในอนาคต


ราคา
ตั้งแต่ 25/09/2025
25
การขาย
333
ติดตั้งฟรี