
Bollinger Bands Cloud
Wskaźnik
Wersja 1.0, Oct 2025
Windows, Mac
4.5
Opinie: 2
Opis
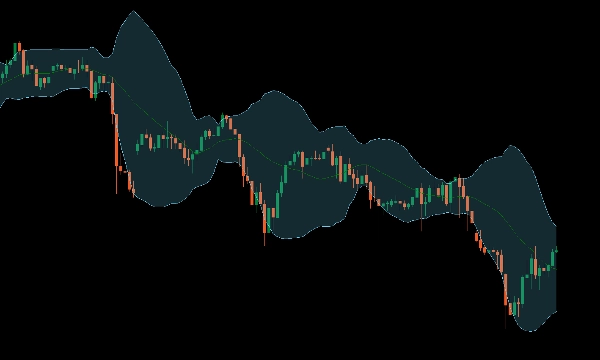
Przedstawiamy nasz ulepszony wskaźnik Bollinger Bands, zaprojektowany, aby podnieść jakość Twojego handlu dzięki wyraźniejszej wizualizacji.
To wizualne ulepszenie ułatwia interpretację zmienności rynku oraz identyfikację potencjalnych punktów wybicia i odwrócenia. Idealne dla traderów poszukujących jaśniejszych wskazówek i lepszego podejmowania decyzji.
Ulepsz swój zestaw narzędzi handlowych już dziś, aby uzyskać ostrzejszą analizę i lepsze wyniki.
Podsumowanie
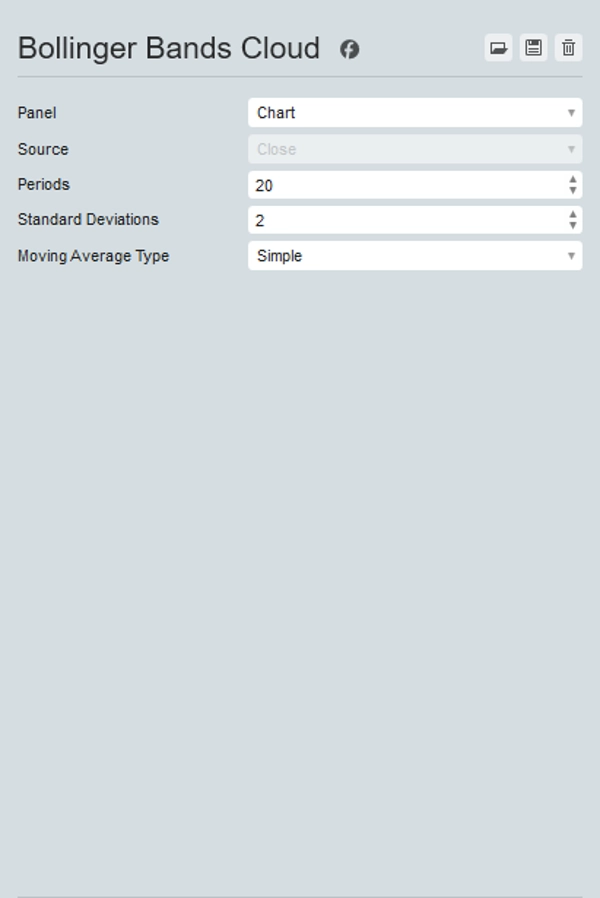
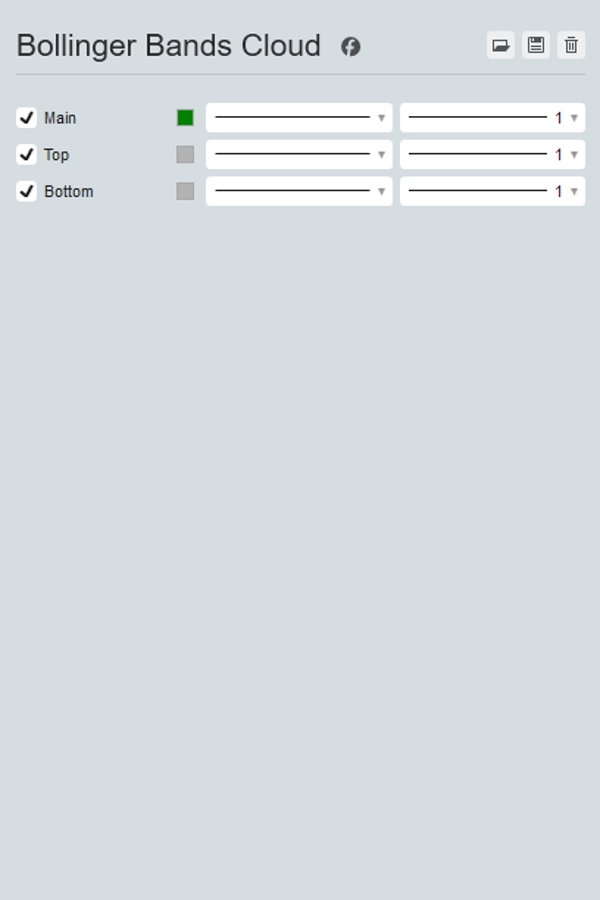
Profil wskaźnika
Opinie klientów
4.5
Opinie: 2
5 | 50 % | |
4 | 50 % | |
3 | 0 % | |
2 | 0 % | |
1 | 0 % |
Opinie klientów
October 27, 2025
Win rate means less without average R. It helps separate patience from hesitation.
October 20, 2025
The setup gets reviewed from another angle, but overconfidence is the real danger.
Dyskusja
Częste pytania
BTCUSD
Forex
Signal
Breakout
Indices
EURUSD
Commodities
GBPUSD
NZDUSD
Bollinger
Prop
Scalping
Crypto
Stocks
XAUUSD
NAS100
USDJPY
Produkty dostępne za pośrednictwem cTrader Store, w tym boty handlowe, wskaźniki i wtyczki, dostarczane są przez deweloperów zewnętrznych i udostępniane wyłącznie w celach informacyjnych oraz w celu zapewnienia dostępu technicznego. cTrader Store nie jest brokerem i nie zapewnia doradztwa inwestycyjnego, nie udziela spersonalizowanych rekomendacji ani nie gwarantuje przyszłych wyników.


Cena
Od 25/09/2025
25
Sprzedaż
331
Bezpłatne instalacje