
MACD Histogram PRO
Wskaźnik
4 zakupy
Wersja 1.0, Oct 2025
Windows, Mac
4.5
Opinie: 2
Opis
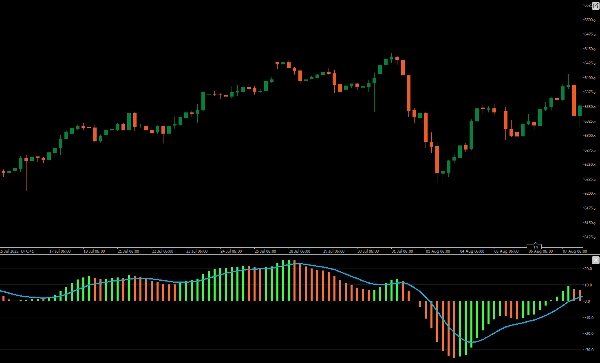
Przedstawiamy ulepszony Histogram MACD, zaprojektowany, aby zapewnić jaśniejsze i bardziej wnikliwe doświadczenie handlowe.
Ten ulepszony wskaźnik wyświetla żywy, kolorowy histogram, który rozróżnia bycze i niedźwiedzie zmiany cen, wykraczając poza domyślny jednokolorowy format. Dzięki zastosowaniu różnych kolorów dla ruchów pozytywnych i negatywnych, oferuje natychmiastową wskazówkę wizualną dotyczącą warunków rynkowych, ułatwiając interpretację zmian momentum i potencjalnych odwróceń trendu.
Idealny dla traderów poszukujących większej jasności i precyzji, ten Histogram MACD ulepszenie przekształca Twój wykres w potężniejsze narzędzie analityczne. Podnieś swoją strategię handlową dzięki ulepszonemu Histogramowi MACD.
Podsumowanie
Podsumowanie AI
MACD Histogram PRO is an enhanced technical indicator designed to improve the visualization of the traditional MACD histogram. It displays a vibrant, color-coded histogram that clearly differentiates bullish and bearish price movements, providing immediate visual cues on market momentum and potential trend reversals. This indicator supports analysis across various markets and symbols including Forex (EURUSD, GBPUSD, NZDUSD, USDJPY), cryptocurrencies (BTCUSD, crypto), commodities (XAUUSD, gold, oil, silver), indices (NAS100, SP500, DAX, Dow), and stocks. By using distinct colors for positive and negative momentum shifts, it aids traders in interpreting market conditions with greater clarity and precision. The MACD Histogram PRO is suitable for strategies involving signals and scalping, enhancing chart analysis for more informed trading decisions.
Profil wskaźnika
Opinie klientów
4.5
Opinie: 2
5 | 50 % | |
4 | 50 % | |
3 | 0 % | |
2 | 0 % | |
1 | 0 % |
Opinie klientów
October 22, 2025
the only reason it stays interesting is one quick look should not become the only input, and 1.5R target is the line to watch.
October 17, 2025
Dyskusja
Częste pytania
BTCUSD
Forex
Signal
Indices
EURUSD
Commodities
GBPUSD
NZDUSD
Prop
Scalping
Crypto
Stocks
XAUUSD
NAS100
MACD
USDJPY
Produkty dostępne za pośrednictwem cTrader Store, w tym boty handlowe, wskaźniki i wtyczki, dostarczane są przez deweloperów zewnętrznych i udostępniane wyłącznie w celach informacyjnych oraz w celu zapewnienia dostępu technicznego. cTrader Store nie jest brokerem i nie zapewnia doradztwa inwestycyjnego, nie udziela spersonalizowanych rekomendacji ani nie gwarantuje przyszłych wyników.


Cena
Od 25/09/2025
25
Sprzedaż
315
Bezpłatne instalacje