
Opis
🌐 Zmiana Struktury Rynku – Profesjonalny Oscylator Struktury Rynku
Zidentyfikuj Prawdziwy Kierunek Trendu. Filtruj Szumy. Handluj z Pewnością.
Zmiana Struktury Rynku to oscylator strukturalnego trendu nowej generacji stworzony dla traderów, którzy chcą jasności, dokładności i niezawodności w każdych warunkach rynkowych.
Zamiast polegać na opóźnionych średnich kroczących lub narzędziach opartych na zmienności, ten wskaźnik koncentruje się na sednie zachowania ceny: maksima wahadłowe i minima wahadłowe.
Efektem jest czysty, bardzo responsywny model trendu, który pomaga natychmiast zidentyfikować:
- Prawdziwe nastawienie rynku
- Przejścia strukturalne
- Siłę kontynuacji trendu
- Ukryte zmiany momentum
Niezależnie od tego, czy handlujesz swingowo, intraday, czy korzystasz z systemów algorytmicznych, Zmiana Struktury Rynku wprowadza profesjonalne ramy strukturalne bezpośrednio na twój wykres.
🔥 Dlaczego Struktura Rynku Ma Znaczenie
Większość wskaźników analizuje cenę po jej ruchu.
Struktura rynku działa inaczej — mierzy fundament rozwoju trendu:
- Wyższe Maksima / Wyższe Minima → Struktura bycza
- Niższe Maksima / Niższe Minima → Struktura niedźwiedzia
To ujawnia kierunek, w którym rynek się rozwija, a nie tylko to, co cena robi z chwili na chwilę.
Zmiana Struktury Rynku automatyzuje cały ten proces i przekształca go w łatwy do odczytania oscylator.
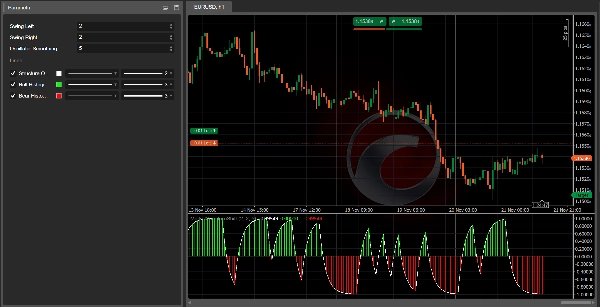
📊 Co Pokazuje Wskaźnik
✔ 1. Linia Oscylatora Struktury (Biała)
Wygładzona linia trendu oparta na EMA, która wyraźnie pokazuje dominującą strukturę:
- Powyżej 0 → Struktura bycza
- Poniżej 0 → Struktura niedźwiedzia
- Blisko 0 → Niestabilność struktury lub przejście trendu
Jedno spojrzenie ujawnia, gdzie rynek naprawdę się znajduje.
✔ 2. Byczy Histogram (Zielony)
Pokazuje siłę i momentum wewnątrz byczej struktury.
Silniejsze słupki = silniejsza presja wzrostowa.
Idealny do potwierdzania ustawień długich.
✔ 3. Niedźwiedzi Histogram (Czerwony)
Pokazuje momentum i siłę struktury niedźwiedziej.
Silniejsze słupki = silniejszy trend spadkowy.
Idealny do potwierdzania okazji krótkich.
🎯 Jak Traderzy Korzystają z Wskaźnika (Profesjonalny Workflow)
A. Filtr Potwierdzający Trend
Handluj tylko w kierunku strukturalnego momentum:
- Transakcje długie, gdy oscylator jest powyżej 0
- Transakcje krótkie, gdy oscylator jest poniżej 0
Ta prosta zasada eliminuje wiele fałszywych sygnałów.
B. Wykrywanie Odwrócenia Strukturalnego
Główne przejścia są widoczne, gdy oscylator przecina linię zerową:
- Czerwony → Zielony = Nowa struktura bycza
- Zielony → Czerwony = Nowa struktura niedźwiedzia
Daje to wczesny wgląd w zmiany trendu na długo przed reakcją tradycyjnych narzędzi.
C. Optymalizacja Wielookresowa
Wskaźnik jest wyjątkowo skuteczny w workflow wielookresowym (MTF):
- Używaj H4/H1 do ramy trendu
- Używaj M30/M15 do wejść
Zapobiegaj transakcjom przeciwnym do trendu i maksymalizuj dokładność.
D. Synergia z Sygnałami Struktury Rynku
Zmiana Struktury Rynku staje się kompletnym systemem handlowym, gdy jest połączona z Sygnałami Struktury Rynku, które dostarczają:
- strzałki KUP/SPRZEDAJ
- wizualne markery zmian
- alerty o przełamaniach strukturalnych
Razem tworzą pełną metodologię opartą na strukturze od góry do dołu.
⚙️ Stworzony dla Wszystkich Rynków
✔ Forex
✔ Indeksy
✔ Kryptowaluty
✔ Metale
✔ Rynki syntetyczne
✔ Kontrakty terminowe (poprzez proxy CFD)
Wysoce adaptowalny dzięki kontroli parametrów nad:
- Wykrywaniem wahadeł
- Siłą wygładzania
- Czułością na zmiany strukturalne
📈 Zalecane Ustawienia
- Wahadło Lewo/Prawo: 2–3 dla Forex i Indeksów, 3–3 dla Kryptowalut
- Wygładzanie Oscylatora: 5–8 dla zrównoważonej responsywności
Gotowy do użycia od razu, ale w pełni konfigurowalny.
💬 Dołącz do Naszej Społeczności po Darmowe Narzędzia i Optymalizacje
Kliknij link w moim profilu, aby dołączyć do naszej społeczności tradingowej, gdzie znajdziesz:
- Optymalizowane zestawy parametrów
- Dodatkowe narzędzia
- Strategie oparte na strukturze
- Ekskluzywne zasoby dla wskaźników AlgoTrend
Świetne miejsce do rozwijania swojego systemu i poprawy konsekwencji.
Podsumowanie
Traders use Market Structure Shift for trend confirmation by trading only in the direction of structural momentum, detecting structural reversals via zero-line crossings, and optimizing multi-timeframe workflows (e.g., H4/H1 for trend framework, M30/M15 for entries). It integrates with Market Structure Signals to provide buy/sell arrows, visual shift markers, and structural break alerts, forming a comprehensive structure-based trading system.
The indicator supports multiple markets including Forex, indices, cryptocurrencies, metals, synthetic markets, and futures (via CFDs). It offers customizable parameters for swing detection, smoothing, and sensitivity to structural changes, enabling adaptability across different asset classes and trading styles.
Opinie klientów
5 | 0 % | |
4 | 100 % | |
3 | 0 % | |
2 | 0 % | |
1 | 0 % |


![Logo „[Hamster-Coder] Bollinger Bands”](https://cdn.ctrader.com/image/webp/21d8e5d6-fb11-4bac-b9ee-cd05c2b76804_30327)


