
Opis
Volume Bubbles – niestandardowy wskaźnik cTrader
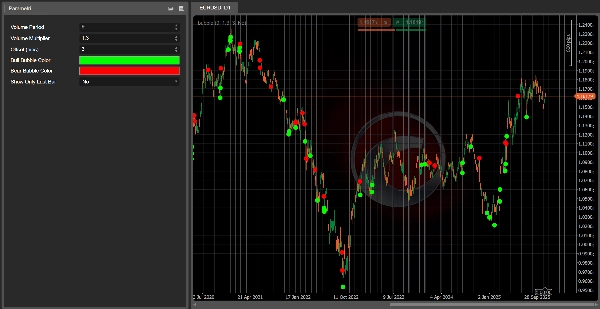
Volume Bubbles to lekki, lecz potężny wizualny wskaźnik dla cTrader, który wyróżnia świece o wyjątkowej objętości bezpośrednio na wykresie cenowym.
Zamiast wpatrywać się w histogram wolumenu i próbować zgadnąć, które słupki naprawdę mają znaczenie, to narzędzie automatycznie wykrywa, kiedy wolumen bieżącej świecy jest znacznie wyższy niż ostatnia średnia i rysuje bańkę (ikona koła) na tym słupku:
- Dla świec wzrostowych bańka jest rysowana poniżej minimum świecy.
- Dla świec spadkowych bańka jest rysowana powyżej maksimum świecy.
Dzięki temu bardzo łatwo jest dostrzec potencjalne kulminacyjne ruchy, obszary silnego zainteresowania dużych graczy lub możliwe punkty wyczerpania trendu.
Kluczowe cechy
- ✅ Wykrywa świece o wysokim wolumenie za pomocą średniej kroczącej wolumenu ticków
- ✅ Rysuje wyraźne bańki na wykresie (nie jest potrzebne dodatkowe podokno)
- ✅ Różne kolory dla wzrostowych i spadkowych skoków wolumenu
- ✅ Regulowany offset w pipsach do pozycjonowania baniek z dala od świecy
- ✅ Opcja pokazywania baniek tylko na najnowszym słupku (do handlu w czasie rzeczywistym)
Wejścia / Parametry
- Okres wolumenu – liczba słupków używanych do średniej kroczącej wolumenu.
- Mnożnik wolumenu – ile razy powyżej średniego wolumenu musi być słupek, aby wywołać bańkę.
- Offset (pipsy) – odległość między bańką a maksimum/minimum świecy.
- Kolor bańki wzrostowej – kolor baniek na świecach wzrostowych.
- Kolor bańki spadkowej – kolor baniek na świecach spadkowych.
- Pokaż tylko ostatni słupek – jeśli prawda, wyświetla bańki tylko na bieżącym, aktywnym słupku.
Jak używać
Dodaj Volume Bubbles do swojego wykresu i używaj go jako wizualnego filtra do:
- Potwierdzania wybicia popartego silnym wolumenem
- Wykrywania możliwych odwróceń lub świec wyczerpania
- Identyfikowania stref, gdzie duzi gracze mogą być aktywni
To nie jest samodzielny system handlowy, ale doskonałe narzędzie uzupełniające każdą strategię opartą na analizie cen lub podążaniu za trendem, która zwraca uwagę na wolumen.
👉 Dołącz tutaj: Algotrendit Volume Bubbles
Wewnątrz serwera znajdziesz:
- Wsparcie dla tego i innych cBotów/wskaźników
- Dyskusje o strategii i pomysły na optymalizację
- Aktualizacje, wiadomości i przyszłe narzędzia, które udostępniam
Podsumowanie
Key features include adjustable parameters such as the volume period for averaging, volume multiplier threshold, bubble offset in pips, and customizable colors for bullish and bearish volume spikes. Users can also choose to display bubbles only on the latest bar for real-time trading. The indicator integrates directly on the price chart without requiring additional subwindows.
Volume Bubbles serves as a visual filter to confirm breakouts supported by strong volume, spot possible reversals or exhaustion candles, and identify zones of significant market activity. It complements price action and trend-following strategies by providing volume-based insights across various markets including forex, indices, commodities, stocks, and cryptocurrencies.
Opinie klientów
5 | 0 % | |
4 | 100 % | |
3 | 0 % | |
2 | 0 % | |
1 | 0 % |


![Logo „High-Low Divergence [Iridio Capital]”](https://cdn.ctrader.com/image/webp/443c4661-7abb-40f1-842f-4b6ec560649b_40914)


