
Opis
Prognozowanie cen oparte na MACD
Przegląd
Ten wskaźnik przełamuje ograniczenia tradycyjnego MACD, wychodząc poza analizę historyczną, wprowadzając innowacyjnie pamięć historyczną i algorytmy statystyczne do prognozowania przyszłych ruchów cen.
Główne mechanizmy:
- Pamięć trendów historycznych: Wskaźnik rejestruje przemieszczenie cenowe przeszłych trendów MACD (zarówno wzrostowych, jak i spadkowych) względem ich punktów początkowych, budując statystyczną bazę danych do 50 ostatnich trendów.
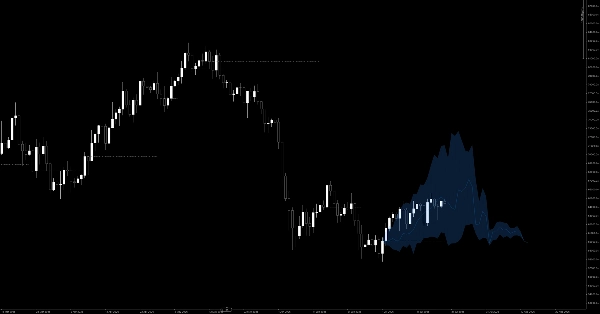
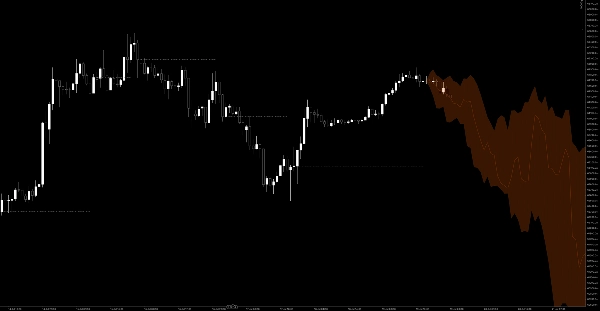
- Wachlarz prognozowania prawdopodobieństwa: Gdy następuje nowe przecięcie MACD (przekroczenie linii zerowej lub linii sygnału), wskaźnik pobiera dane z pamięci historycznej. Oblicza 20%, 50% i 80% percentyle zmian cen i wyświetla wachlarz prognozowania prawdopodobieństwa na następne 100 słupków po prawej stronie wykresu.
- Dynamiczna chmura obszaru sygnału: Oznacza "cenę odniesienia", od której rozpoczęła się zmiana trendu. Gdy cena w czasie rzeczywistym znajduje się powyżej tej ceny odniesienia w trendzie wzrostowym, maluje zieloną chmurę; odwrotnie, w trendzie spadkowym maluje czerwoną chmurę. Zapewnia to natychmiastowe wizualne potwierdzenie faktycznego momentum wzrostowego lub spadkowego.
(Uwaga: Ten wskaźnik cechuje się wysoce zoptymalizowanym renderowaniem graficznym, wykorzystującym płynne mieszanie wielokątów dla wyraźnych stref wizualnych oraz dopracowaną przerywaną linię odniesienia dla niezwykle czystego doświadczenia na wykresie.)
Zasady handlu i przewodnik użytkownika
Ten wskaźnik wykracza poza proste sygnały "kup/sprzedaj przy przecięciu" — dostarcza prawdopodobną mapę drogową dla Twoich transakcji.
1. Znajdowanie wejść (potwierdzenie trendu)
- Wejścia długie: Gdy następuje bycze przecięcie MACD, pojawi się niebieski wachlarz prognozujący wzrost po prawej stronie. Nie wchodź pochopnie. Poczekaj, aż cena ustabilizuje się powyżej linii kreskowo-kropkowanej (cena odniesienia) i zacznie się rozszerzać zielona bycza chmura. To potwierdza, że obecne momentum odpowiada historycznym statystykom byczym, dając solidną okazję do kupna na spadku.
- Wejścia krótkie: Gdy następuje niedźwiedzie przecięcie MACD, pojawi się pomarańczowy wachlarz prognozujący spadek. Obserwuj, czy cena pozostaje poniżej linii odniesienia z rozszerzającą się czerwoną niedźwiedzią chmurą, aby potwierdzić wejście krótkie na korekcie.
2. Ustalanie celów Take Profit
Wachlarz prognozowania działa jako doskonały dynamiczny przewodnik po zyskach:
- Cel 1 (Linia środkowa): Linia środkowa wewnątrz wachlarza reprezentuje 50% percentyl historyczny (średnia trajektoria). Gdy cena dotyka tej linii, oznacza to, że obecny ruch osiągnął historyczną średnią, co czyni to idealnym miejscem na częściowe realizowanie zysków.
- Cel 2 (Zewnętrzne krawędzie wachlarza): Górna granica (80% percentyl) lub dolna granica (20% percentyl) reprezentują historyczne ekstremy. Jeśli cena osiąga te krawędzie, momentum jest mocno wyczerpane, a odwrócenie lub głęboka korekta są bardzo prawdopodobne. Rozważ zamknięcie całej pozycji.
3. Naukowe ustawienie Stop Loss
- Szara linia przerywana (cena odniesienia) pełni rolę linii bazowej dla każdego trendu.
- Przy wejściu długim ustaw stop loss nieco poniżej tej szarej linii. Jeśli cena przebije cenę odniesienia, a zielona chmura zniknie, oznacza to, że faktyczny ruch cenowy unieważnił historyczne prawdopodobieństwo bycze. Ustawienie trendu zawiodło i powinieneś natychmiast ograniczyć straty.
4. Filtr rynku bocznego
- Jeśli nastąpi przecięcie MACD, ale prognozowany wachlarz prognozowania jest bardzo płaski lub skurczony, oznacza to, że historycznie podobne przecięcia skutkowały jedynie chaotycznym, bocznym ruchem.
- Gdy widzisz płaski wachlarz, powstrzymaj się od handlu. Poczekaj na kolejny cykl, w którym wachlarz pokaże wyraźne rozszerzenie w górę lub w dół.
Podsumowanie
Key features include a probability forecasting fan that projects 20%, 50%, and 80% price change percentiles for the next 100 bars following a MACD crossover. The indicator visually displays this fan on the chart, with blue fans for bullish signals and orange for bearish. A dynamic signal area cloud highlights momentum: green for confirmed uptrends above a reference price and red for downtrends below it.
Trading guidance involves waiting for price confirmation above or below the reference price and cloud before entering long or short positions. The forecasting fan also serves as a dynamic take-profit guide, with the middle line representing average historical moves and outer edges indicating potential trend exhaustion. Stop-loss placement is recommended just beyond the reference price line to manage risk.
Additionally, the indicator filters ranging markets by identifying flat or contracted fans, signaling sideways price action and advising traders to avoid entering trades during such periods. The indicator supports visualization outputs and is tagged under MACD and momentum indicators.