
NEW ORDER FLOW MARKET DEPTH
Indicator
4 purchases
Version 1.0, Mar 2026
Windows, Mac
4.0
Reviews: 1
Description
Order Flow Market Depth Pro brings institutional trading concepts to the retail cTrader platform. By analyzing tick-level data, this indicator reveals the hidden buying and selling pressure inside every candle. Whether you trade Forex, Indices, or Commodities, understand the true market sentiment with precise Footprint charts and Depth of Market overlays.
Key Features
- 🔍 Volume Profile Modes: Choose between Normal Volume, Buy/Sell Split, or Delta Analysis.
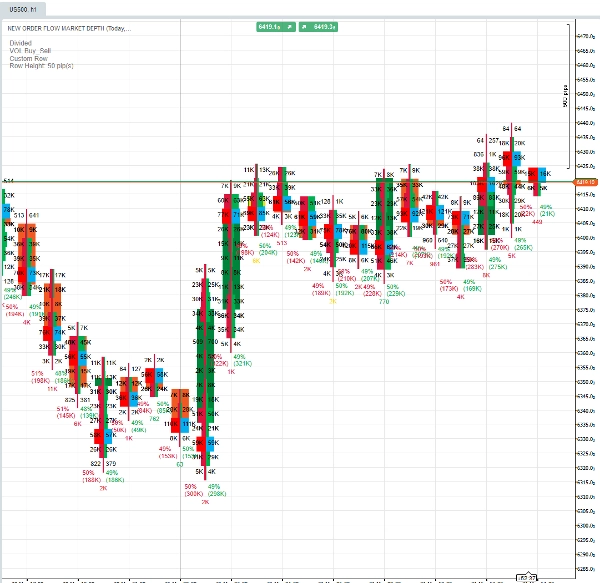
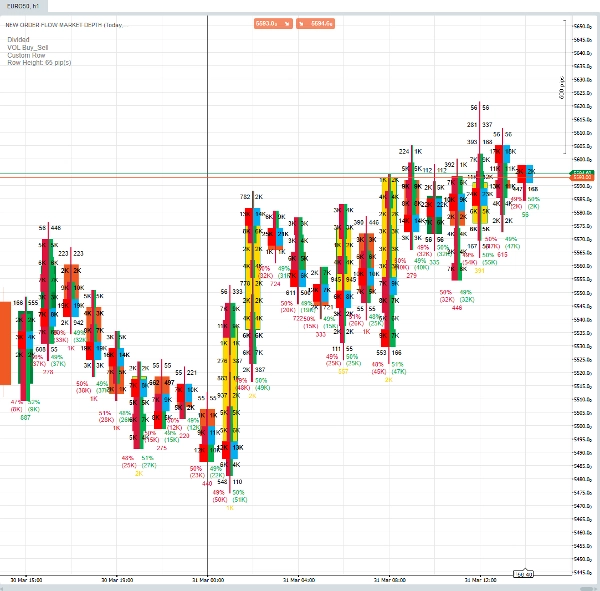
- 📊 Footprint Charts: Visualize Bid vs. Ask volume at every price level (Divided or Profile mode).
- 📈 Delta Analysis: Track aggressive buying vs. selling pressure with Cumulative Delta filtering.
- 📉 Live Market Depth (DOM): Visualize live limit order books directly on the chart (Bid/Ask liquidity walls).
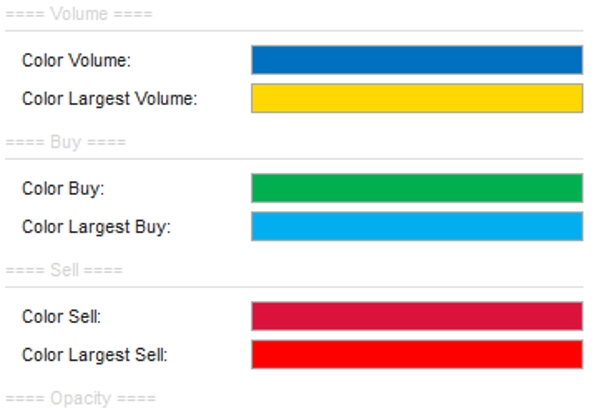
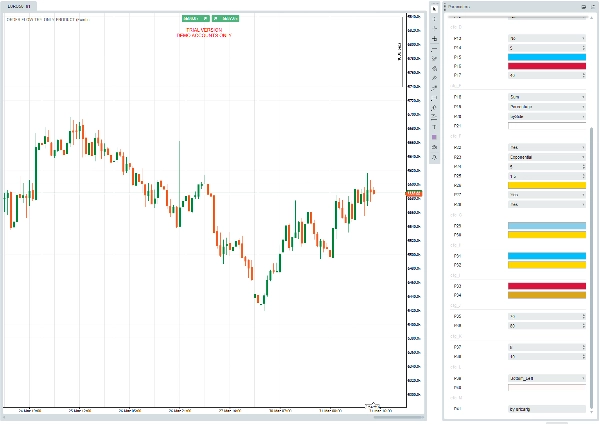
- 🎨 Customizable Visualization: Fully adjustable colors, opacity, row heights, and font sizes to match your trading style.
- 🚀 Smart Filtering: Built-in Moving Average filters to highlight significant volume spikes and ignore noise.
- ⚡ High Performance: Optimized for Renko, Range, and Tick charts with efficient data handling.
Trial Version Details
- Demo Account Only: This trial version is fully functional but restricted to Demo Accounts.
- 14-Day Limit: The indicator will remain active for 14 days from the first time you attach it to a chart.
- Visual Watermark: Trial status is displayed on the chart to ensure compliance.
How to Use
- Attach the indicator to your desired chart.
- Select your VOL Mode (Normal, Buy/Sell, or Delta).
- Adjust Row Config to "Predefined" for standard timeframes or "Custom" for Renko/Range.
- Enable Show DOM to see live liquidity levels (requires live data feed).
- Use the Large Result Filter to highlight bars with abnormal volume activity.
Requirements
- cTrader Desktop or Web platform.
- Access to Tick Data (automatically loaded by the indicator).
- Demo Account (for Trial Version).
Support & Updates
- Regular updates for compatibility with new cTrader builds.
- Dedicated support for installation and configuration questions.
Order Flow, Footprint, Market Depth, DOM, Volume Profile, Delta, Tick Volume, Renko, Range Bars, Institutional, Trial
Summary
AI summary
Order Flow Market Depth Pro is an advanced indicator for the cTrader platform that applies institutional trading concepts to retail trading. It analyzes tick-level data to reveal hidden buying and selling pressure within each candle, supporting markets such as Forex, Indices, and Commodities. Key features include multiple volume profile modes (Normal Volume, Buy/Sell Split, Delta Analysis), Footprint charts that visualize bid versus ask volume at each price level, and cumulative Delta analysis to track aggressive buying and selling pressure. The indicator also displays live Market Depth (DOM) overlays showing real-time limit order books and liquidity walls directly on the chart. Users can customize visual elements like colors, opacity, row heights, and fonts to suit their trading style. Smart filtering with built-in Moving Average filters highlights significant volume spikes while reducing noise. It is optimized for Renko, Range, and Tick charts, ensuring high performance and efficient data handling. The trial version is fully functional on demo accounts for 14 days and includes a visual watermark. Requirements include the cTrader Desktop or Web platform and access to tick data, which the indicator loads automatically. Regular updates and dedicated support are provided for installation and configuration.
Indicator profile
Indicator category
Order flow / DoM
Output type
Visualisation
Data requirements
Bars only
Tick data
DoM
Volume
Supported signals
Session opening range
Divergence
Customer reviews
4.0
Reviews: 1
5 | 0 % | |
4 | 100 % | |
3 | 0 % | |
2 | 0 % | |
1 | 0 % |
Customer reviews
April 9, 2026
The better read comes from bad setups become easier to pass on. Volume context feels better when the tool stays in the background.
Discussion
FAQ
Signal
Products available through cTrader Store, including trading bots, indicators and plugins, are provided by third-party developers and made available for informational and technical access purposes only. cTrader Store is not a broker and does not provide investment advice, personal recommendations or any guarantee of future performance.
More from this author


!["Wyckoff Toolkit [Iridio Capital]" logo](https://cdn.ctrader.com/image/webp/8acfe6a1-6a8e-4578-9367-9df3af2b1801_27763)


Price
49
Sales
306
Free installs