Unlock the secrets of market structure with the ultimate all-in-one Volume Profile and Order Flow analysis tool. One-time purchase, use forever (no need for monthly subscriptions)
Volume Profile, Order Flow Imbalance & Liquidity Engine Indicator, is not just a standard histogram; it is a comprehensive trading engine designed for serious price action and volume traders. It combines institutional-grade Volume Profile metrics (TPO and Volume) with advanced Order Flow algorithms (OFI and OV) to identify high-probability reversal and breakout zones.
Whether you are scalping the H1 chart or analysing daily structures, this indicator provides the context you need to trade with the "Smart Money."
Key Features
Advanced Volume Profile & TPO Analysis
- Multi-Timeframe Profiles: Plot Daily (D1) or custom timeframe profiles on lower timeframes (e.g., view Daily Value Areas on an H1 chart).
- Point of Control (POC): analysing the price level with the highest volume activity. Tracks POC migration to identify trend acceptance.
- Value Area (VA): Automatically calculates the Value Area High (VAH) and Value Area Low (VAL) based on 70% volume distribution.
- Initial Balance (IB): Highlights the opening range (default 30 mins) and signals breakouts, crucial for day traders.
The "Engine" Signals (Order Flow & Exhaustion)
- OFI (Order Flow Imbalance): Detects aggressive buying or selling pressure that contradicts price movement or confirms a breakout.
- Green Triangles/Text: OFI Buy Signal (Aggressive buying).
- Red Triangles/Text: OFI Sell Signal (Aggressive selling).
- OV (Overvaluation/Volume Warning): Identifies when price is overextended relative to volume, Visuals potential reversals or exhaustion.
- Orange Markers: OV Warning (Caution zone).
- VP Signals: Specific signals for "In Value" (price inside the value area) and "VA Breakout" (price leaving the value area with momentum).
Liquidity & Depth
- Liquidity Depth: signalling liquidity clusters above and below the current price to identify potential support/resistance zones.
- Naked POCs: Tracks untested Point of Control levels from previous sessions, which often act as magnets for price.
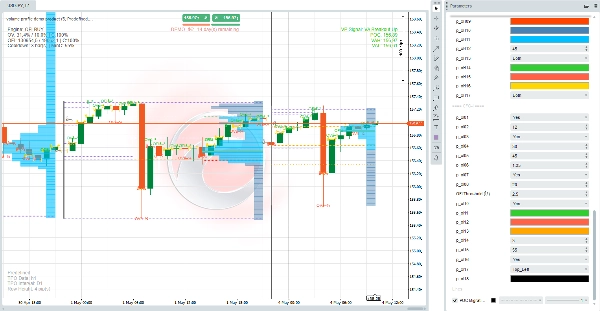
📊 Visual Guide
- Histograms: Blue and Grey bars on the right represent volume distribution at specific price levels.
- Signal Markers:
- 🟢 Green Arrows/Text: Buy signals (OFI Buy, VA Breakout Up).
- 🔴 Red Arrows/Text: Sell signals (OFI Sell, VA Breakout Down).
- 🟡 Yellow Lines: Value Area boundaries (VAH/VAL) or Initial Balance levels.
- Info Panel: A dedicated panel in the top-left corner displays real-time statistics:
- Current Engine State (e.g., "OFI BUY", "OV WARN").
- Overvaluation percentages.
- OFI ratios.
⚙️ Customization
The indicator is highly configurable via the input panel:
- Profile Settings: Adjust Lookback bars, Row Height, and Value Area percentage.
- Engine Settings: Fine-tune OFI and OV sensitivity (Sigma thresholds, Lookback bars).
- Visuals: Change Visuals for POC, VA, Signals, and the Volume Panel to match your chart theme.
💡 Who is this for?
- Day Traders: Use the Initial Balance and Daily Value Areas to plan your session.
- Scalpers: Use OFI and OV signals for precise entry triggers.
- Swing Traders: Identify major support/resistance via Naked POCs and high-volume nodes.
Disclaimer: Trading involves risk. This tool is for analysis purposes only and does not guarantee profits. Always backtest strategies before live trading. Unauthorised
2026 DATARUM ALGORITHMICA. All Rights Reserved.
- Intellectual Property: This indicator, including all source code, visual design, algorithms, documentation, and branding, is the exclusive intellectual property of DATARUM ALGORITHMICA. Unauthorised reproduction, distribution, resale, or modification of this product is strictly prohibited.
- No Financial Advice: DATARUM ALGORITHMICA develops and provides professional technical analysis tools for educational and informational purposes only. Nothing contained in this product, its documentation, or associated communications constitutes financial, investment, legal, or tax advice. Users are solely responsible for their trading decisions.
- Risk Warning – CFD & Forex Trading: Trading Contracts for Difference (CFDs), Forex, and other leveraged financial instruments carry a high level of risk and may not be suitable for all investors. You could lose some or all of your invested capital. Past performance of this indicator is not indicative of future results.
- User Responsibility: By purchasing or using this product, you confirm that:
- You are a legally adult in your jurisdiction and authorised to engage in financial trading.
- You understand the risks involved in leveraged trading.
- You accept full responsibility for any losses, damages, or consequences arising from the use of this tool.
5 | 100 % | |
4 | 0 % | |
3 | 0 % | |
2 | 0 % | |
1 | 0 % |