
WVAP-Bands Indicator_noSourceCode
Indikator
1 pembelian
Versi 1.0, Sep 2025
Windows, Mac
4.5
Ulasan: 2
Penerangan
VWAP Bands - Analisis Isipadu Profesional
Transformasikan Perdagangan Anda dengan Ketepatan Gred Institusi
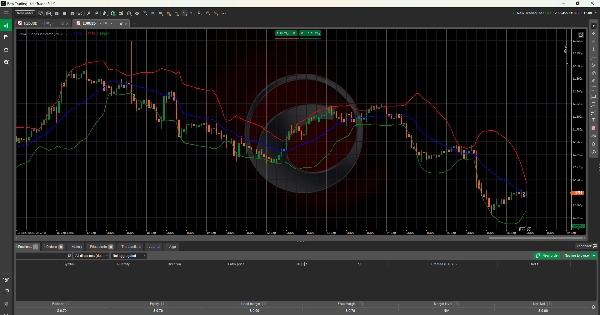
Penunjuk VWAP Bands menyediakan analisis harga berwajaran isipadu profesional dengan jalur sisihan piawai dinamik. Digunakan oleh pedagang institusi di seluruh dunia untuk mengenal pasti titik masuk dan keluar yang optimum.
🚀 Ciri Utama
- Pengiraan VWAP Sebenar: Harga purata berwajaran isipadu menggunakan metodologi HLC/3
- Jalur Dinamik: Jalur atas/bawah berdasarkan sisihan piawai berwajaran isipadu
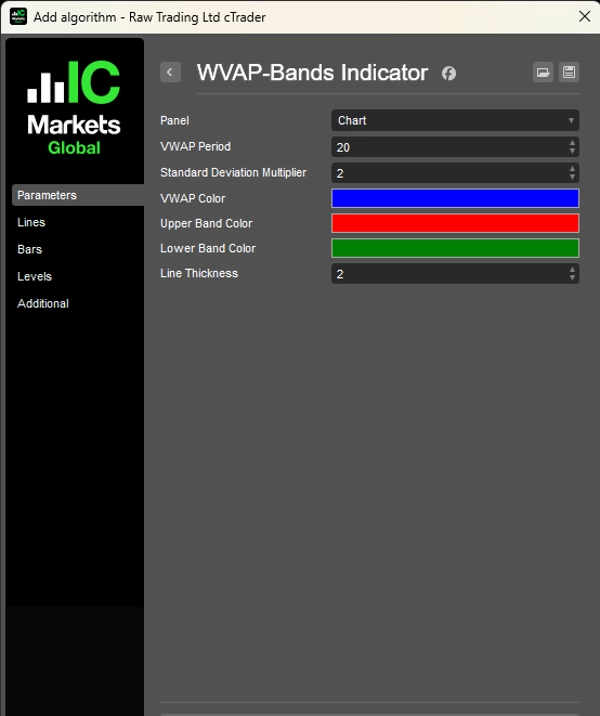
- Penyesuaian Penuh: Tempoh, warna, dan pengganda lebar jalur yang boleh disesuaikan
- Analisis Masa Nyata: Dikemas kini dengan setiap bar untuk pandangan pasaran segera
📊 Aplikasi Perdagangan
- Jual Beli Berlebihan: Jalur atas = isyarat jual, Jalur bawah = isyarat beli
- Sokongan/Perlawanan Dinamik: VWAP bertindak sebagai tahap rujukan institusi
- Pembalikan Purata: Perdagangan pembalikan apabila harga melanjut ke ekstrem jalur
- Pengesahan Trend: Pecahan kuat melalui jalur menandakan kesinambungan
⚙️ Tetapan Profesional
- Tempoh VWAP: 1-200 bar (lalai: 20)
- Sisihan Piawai: Pengganda 0.1-5.0 (lalai: 2.0)
- Penyesuaian Visual: Warna dan ketebalan garis tersuai
- Berbilang Tempoh Masa: Berfungsi pada semua tempoh masa dan instrumen
✅ Kenapa VWAP Bands?
Lebih unggul daripada purata bergerak mudah, VWAP Bands menyediakan:
- Ketepatan berwajaran isipadu untuk analisis institusi sebenar
- Jalur volatiliti adaptif yang menyesuaikan dengan keadaan pasaran
- Metodologi profesional yang digunakan oleh pedagang berjaya di seluruh dunia
- Aplikasi universal merangkumi forex, saham, kripto, dan komoditi
Sesuai untuk scalper, pedagang harian, dan pedagang ayunan yang mencari analisis isipadu profesional.
Serasi dengan cTrader 4.0+. Berfungsi pada semua instrumen dan tempoh masa.
Ringkasan
Ringkasan AI
The WVAP-Bands Indicator provides volume-weighted average price (VWAP) analysis enhanced with dynamic standard deviation bands. It calculates VWAP using the HLC/3 price method and overlays upper and lower bands based on volume-weighted standard deviation, offering adaptive volatility measures. The indicator supports full customization of periods, colors, and band width multipliers, allowing traders to tailor it to their strategies. It updates in real time with each new bar, delivering immediate market insights.
Key trading applications include identifying overbought and oversold conditions (upper band signals sell, lower band signals buy), dynamic support and resistance levels with VWAP as an institutional reference, mean reversion opportunities when prices reach band extremes, and trend confirmation through breakouts beyond the bands. Settings allow adjustment of VWAP period (1–200 bars), standard deviation multiplier (0.1–5.0), and visual elements such as colors and line thickness.
The indicator is compatible with all timeframes and instruments, including forex, stocks, cryptocurrencies, commodities, and indices. It is designed for scalpers, day traders, and swing traders seeking professional-grade volume analysis and is compatible with cTrader 4.0 and above.
Profil indikator
Ulasan pelanggan
4.5
Ulasan: 2
5 | 50 % | |
4 | 50 % | |
3 | 0 % | |
2 | 0 % | |
1 | 0 % |
Ulasan pelanggan
October 4, 2025
The sample size matters. The useful metric is POC and VWAP first, compare the result with 20 reactions, and only scale if 2 sessions still looks controlled.
October 3, 2025
I liked it more as a extra filter for volume based context than as something to follow blindly. Pressure is easier to read, and the final decision still feels like it belongs to the trader. The next review on it on value area.
Perbincangan
Soalan Lazim
BTCUSD
Forex
Signal
Breakout
Indices
EURUSD
Commodities
GBPUSD
NZDUSD
Prop
Scalping
Crypto
Stocks
XAUUSD
NAS100
USDJPY
VWAP
Produk yang tersedia melalui cTrader Store, termasuk bot dagangan, indikator dan plugin, disediakan oleh pembangun pihak ketiga dan diberikan akses untuk tujuan maklumat dan teknikal sahaja. cTrader Store bukan broker dan tidak memberikan nasihat pelaburan, syor peribadi atau sebarang jaminan prestasi masa hadapan.
Lebih banyak produk daripada penulis ini


Harga
Sejak 15/01/2025
7
Jualan