
Penerangan
Baca pasaran dengan lebih bijak menggunakan AI.
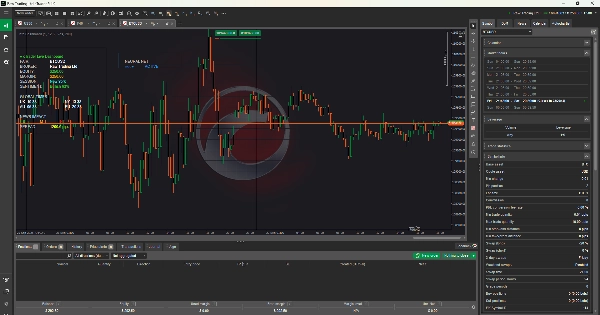
The Info Dashboard adalah rakan dagangan sehenti anda, menggabungkan rangkaian neural, analisis sentimen, dan data pasaran langsung ke dalam satu alat yang berkuasa.
✅ Pandangan Rangkaian Neural AI – Mengesan corak serta-merta dan meramalkan pergerakan pasaran.
✅ Kesan Berita & Sentimen – Sentiasa di hadapan acara yang menggoncang pasaran.
✅ Penjejakan Ekuiti & Baki – Pantau kesihatan akaun anda secara masa nyata.
✅ Jam Pasaran Global – Jangan lepaskan pembukaan atau penutupan sesi.
✅ Pemantau Kekuatan Pasangan & Spread – Kenal pasti peluang terkuat.
Direka untuk forex, kripto, dan indeks, papan pemuka ini memberi anda kejelasan dan kelajuan, mengubah data kompleks menjadi isyarat yang boleh diambil tindakan. Sesuai untuk pedagang baru dan profesional yang mahukan kelebihan dalam pasaran.
Dengan Info Dashboard, anda bukan sahaja mengikuti carta—anda memahaminya.
Tingkatkan dagangan anda hari ini dan alami masa depan analisis pasaran.
Ringkasan
Ulasan pelanggan
5 | 50 % | |
4 | 50 % | |
3 | 0 % | |
2 | 0 % | |
1 | 0 % |


![Logo "[Hamster-Coder] Moving Average MTF"](https://cdn.ctrader.com/image/webp/b11b98b1-194d-4b8e-b00e-d611826ad159_31226)


