
MTF Candle Window - On Chart
Indikator
7 pembelian
Versi 1.0, Feb 2025
Windows, Mac
4.3
Ulasan: 3
Penerangan
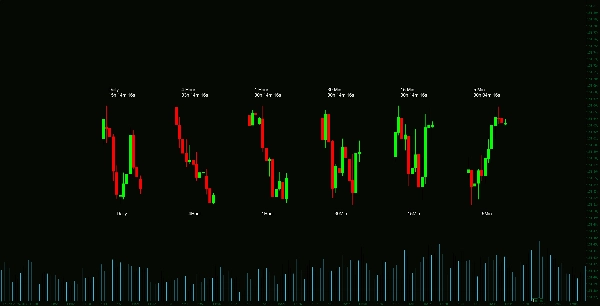
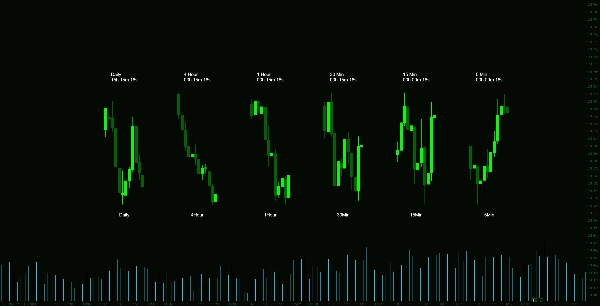
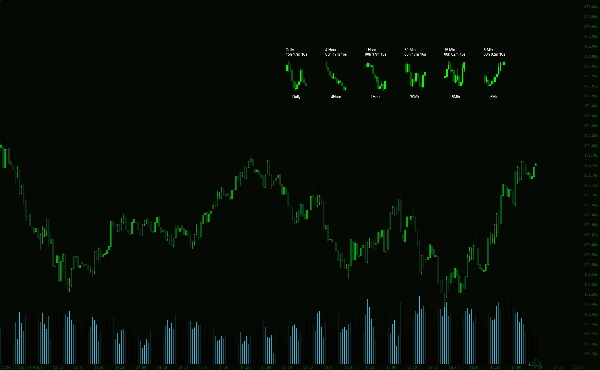
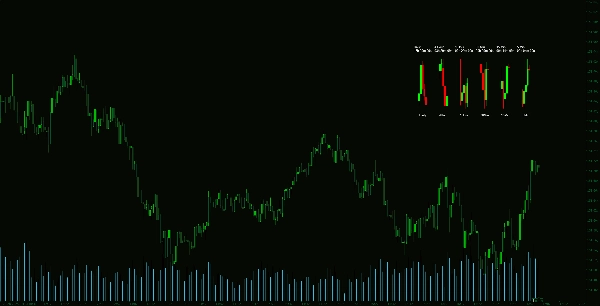
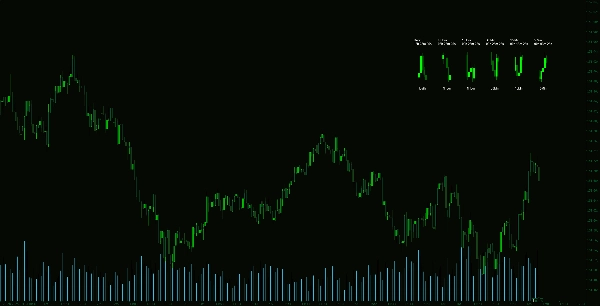
Penunjuk Multi-Timeframe Candle adalah alat yang sangat boleh disesuaikan yang menyediakan pandangan yang jelas dan padat mengenai tindakan harga merentasi jangka masa utama. Ia memaparkan lilin dari pelbagai jangka masa dalam tetingkap khusus, membolehkan pedagang menilai struktur pasaran dengan cepat tanpa menukar carta.
Ciri-ciri Utama:
Ringkasan
Ringkasan AI
The Multi-Timeframe Candle Indicator is a customizable trading tool that displays price candles from multiple major timeframes within a single dedicated window on the chart. This allows traders to efficiently monitor market structure and price action across different timeframes without switching between charts. Key features include adjustable candle height, horizontal and vertical offsets, and the number of candles shown per timeframe. It also offers a dynamic countdown timer indicating the time remaining until each candle closes, positioned at the top or bottom of the candles. Users can fully customize the appearance by modifying colors, text offsets, and font sizes to suit their trading preferences. This indicator supports streamlined market analysis by helping traders quickly identify trends, reversals, and momentum shifts, enhancing decision-making and trade execution.
Profil indikator
Ulasan pelanggan
4.3
Ulasan: 3
5 | 33 % | |
4 | 67 % | |
3 | 0 % | |
2 | 0 % | |
1 | 0 % |
Ulasan pelanggan
February 20, 2025
Entry aware signal check for chart reading. it makes market context easier to scan, especially when used for adding confirmation before a trade. I would test it on 2 timeframes, 20 signals and a 1R stop plan. It is stronger when a 1.5R target is realistic before the entry.
February 19, 2025
February 19, 2025
Setup first trade assistant for a more controlled workflow. It helps with adding confirmation before a trade, but it should not be used as a blind entry trigger. I would test it on 2 timeframes, 20 signals and a 1R stop plan. I would still keep manual review in the process.
Perbincangan
Soalan Lazim
Produk yang tersedia melalui cTrader Store, termasuk bot dagangan, indikator dan plugin, disediakan oleh pembangun pihak ketiga dan diberikan akses untuk tujuan maklumat dan teknikal sahaja. cTrader Store bukan broker dan tidak memberikan nasihat pelaburan, syor peribadi atau sebarang jaminan prestasi masa hadapan.


Harga
Sejak 14/01/2025
55
Jualan
11.36K
Pemasangan percuma